
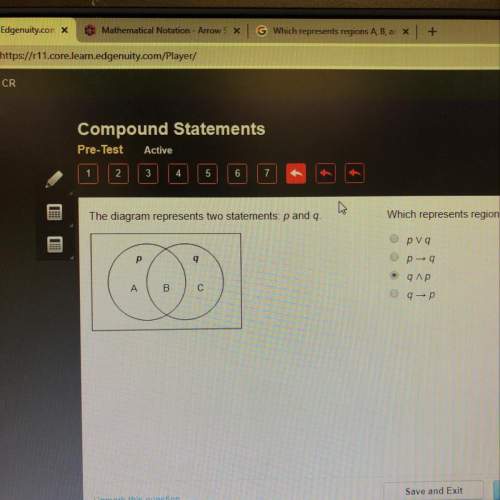
Mathematics, 04.06.2021 23:00 glocurlsprinces
Which graph represents a proportional relationship?
On a coordinate plane, a straight line with negative slope goes through points (2, 6), (4, 5).
On a coordinate plane, a curve opens down.
On a coordinate plane, a straight line with positive slope goes through points (5, 2) and (6, 3).
On a coordinate plane, a straight line with positive slope goes through points (3, 3) and (4, 4).

Answers: 1


Another question on Mathematics
Mathematics, 21.06.2019 18:20
What value of x is in the solution set of 4x - 12 s 16 + 8x? -10 -9 -8 -7
Answers: 1
Mathematics, 21.06.2019 20:30
Give the functions f(x) = |x + 2| - 3, what is the domain? a,b,c, or d all real numbers x > 2 x < -2 all real numbers and x cannot equal to 2
Answers: 1
Mathematics, 21.06.2019 22:00
Students at a high school were asked about their favorite outdoor activity. the results are shown in the two-way frequency table below. fishing camping canoeing skiing total boys 36 44 13 25 118 girls 34 37 22 20 113 total 70 81 35 45 231 select all the statements that are true based on the given table. more girls chose camping as their favorite outdoor activity than boys. more girls chose canoeing as their favorite outdoor activity than those who chose skiing. more boys chose skiing as their favorite outdoor activity than girls. there were more boys surveyed than girls. twice as many students chose canoeing as their favorite outdoor activity than those who chose fishing. more students chose camping as their favorite outdoor activity than the combined number of students who chose canoeing or skiing.
Answers: 1
Mathematics, 22.06.2019 00:30
1.3.25 question suppose 40​% of all voters voted for a particular candidate. to simulate exit polls regarding whether or not voters voted for this​ candidate, five random samples of size 1010 and five random samples of size 10001000 have been generated using technology using a population proportion of 0.400.40​, with the accompanying results. complete parts a through c below. click the icon to view the simulation results. a. observe how the sample proportions of successes vary around 0.400.40. simulation compared to sample prop simulation compared to sample prop 1 ▾ 6 ▾ greater than 0.40 less than 0.40 equal to 0.40 2 ▾ less than 0.40 greater than 0.40 equal to 0.40 7 ▾ greater than 0.40 less than 0.40 equal to 0.40 3 ▾ greater than 0.40 less than 0.40 equal to 0.40 8 ▾ equal to 0.40 greater than 0.40 less than 0.40 4 ▾ greater than 0.40 equal to 0.40 less than 0.40 9 ▾ less than 0.40 greater than 0.40 equal to 0.40 5 ▾ equal to 0.40 less than 0.40 greater than 0.40 10 ▾ equal to 0.40 greater than 0.40 less than 0.40 click to select your answer(s) and then click check answer. 2 parts remaining clear all check answer
Answers: 3
You know the right answer?
Which graph represents a proportional relationship?
On a coordinate plane, a straight line with neg...
Questions

English, 28.03.2021 04:40
English, 28.03.2021 04:40
Mathematics, 28.03.2021 04:40
English, 28.03.2021 04:40
Mathematics, 28.03.2021 04:40
English, 28.03.2021 04:40
Mathematics, 28.03.2021 04:40

Health, 28.03.2021 04:50

Mathematics, 28.03.2021 04:50
Mathematics, 28.03.2021 04:50
Mathematics, 28.03.2021 04:50
Mathematics, 28.03.2021 04:50
Mathematics, 28.03.2021 04:50


