
Mathematics, 05.06.2021 22:40 laequity7325
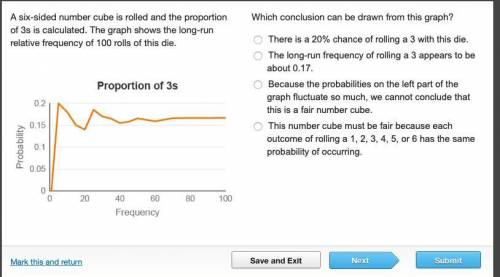
A six-sided number cube is rolled and the proportion of 3s is calculated. The graph shows the long-run relative frequency of 100 rolls of this die.
A graph titled proportion of threes has frequency on the x-axis, and probability on the y-axis. The graph increases, and then stays steady around y = 0.17.
Which conclusion can be drawn from this graph?
There is a 20% chance of rolling a 3 with this die.
The long-run frequency of rolling a 3 appears to be about 0.17.
Because the probabilities on the left part of the graph fluctuate so much, we cannot conclude that this is a fair number cube.
This number cube must be fair because each outcome of rolling a 1, 2, 3, 4, 5, or 6 has the same probability of occurring.

Answers: 2


Another question on Mathematics
Mathematics, 21.06.2019 13:30
The quadratic function h(t) = -16.1t^2 + 150 models a balls height, in feet, over time, in seconds, after its dropped from a 15 story building. from what height in feet was the ball dropped?
Answers: 2
Mathematics, 22.06.2019 02:00
Pleasseee important quick note: enter your answer and show all the steps that you use to solve this problem in the space provided. use the circle graph shown below to answer the question. a pie chart labeled favorite sports to watch is divided into three portions. football represents 42 percent, baseball represents 33 percent, and soccer represents 25 percent. if 210 people said football was their favorite sport to watch, how many people were surveyed?
Answers: 1
Mathematics, 22.06.2019 04:00
1.what effect does replacing x with x−4 have on the graph for the function f(x) ? f(x)=|x−6|+2 the graph is shifted 4 units up. the graph is shifted 4 units down. the graph is shifted 4 units left. the graph is shifted 4 units right. 2.what are the coordinates of the hole in the graph of the function f(x) ? f(x)=x^2+3x−28/x+7 3.which graph represents the function?
Answers: 2
You know the right answer?
A six-sided number cube is rolled and the proportion of 3s is calculated. The graph shows the long-r...
Questions

History, 10.10.2019 06:30
Mathematics, 10.10.2019 06:30

Mathematics, 10.10.2019 06:30
History, 10.10.2019 06:30

Mathematics, 10.10.2019 06:30
Social Studies, 10.10.2019 06:30
Mathematics, 10.10.2019 06:30

History, 10.10.2019 06:30
Physics, 10.10.2019 06:30
Mathematics, 10.10.2019 06:30


Biology, 10.10.2019 06:30


