
Mathematics, 07.06.2021 06:50 cxttiemsp021
Plz help me
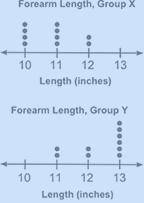
The two dot plots below compare the forearm lengths of two groups of schoolchildren:
Based on the visual inspection of the dot plots, which group appears to have the longer average forearm length? (5 points)
a
Group X, because no child in the group has a forearm length longer than 12 inches.
b
Group X, because four children in the group have the least forearm length of 10 inches.
c
Group Y, because a child in the group has the least forearm length of 10 inches.
d
Group Y, because six children have a forearm length longer than 12 inches.

Answers: 1


Another question on Mathematics
Mathematics, 21.06.2019 14:10
which best describes the transformation from the graph of f(x) = x2 to the graph of f(x) = (x – 3)2 – 1? left 3 units, down 1 unitleft 3 units, up 1 unitright 3 units, down 1 unit right 3 units, up 1 unit
Answers: 1
Mathematics, 21.06.2019 20:50
An object is translated by (x + 4, y - 2). if one point in the image has the coordinates (5, -3), what would be the coordinates of its pre-image? (9, -5) (1, -5) (9, -1) (1, -1)
Answers: 1
Mathematics, 22.06.2019 00:00
At a pizza shop 70% of the customers order a pizza 25% of the customers order a salad and 15% of the customers order both a pizza and a salad if s customer is chosen at random what is the probability that he or she orders either a pizza or a salad
Answers: 1
Mathematics, 22.06.2019 00:40
What is the interquartile range (iqr) of the data set represented by this box plot?
Answers: 3
You know the right answer?
Plz help me
The two dot plots below compare the forearm lengths of two groups of schoolchildren:
Questions


History, 29.01.2020 23:56
History, 29.01.2020 23:56

Geography, 29.01.2020 23:56
Mathematics, 29.01.2020 23:56

Physics, 29.01.2020 23:56
Mathematics, 29.01.2020 23:56

Geography, 29.01.2020 23:56
Mathematics, 29.01.2020 23:56
Mathematics, 29.01.2020 23:56


