
Mathematics, 07.06.2021 23:40 electrofy456
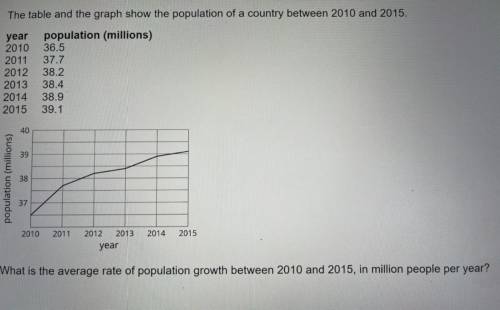
The table and the graph show the population of a country between 2010 and 2015.
year population (millions)
2010 36.5
2011
37.7
2012 38.2
2013 38.4
2014 38.9
2015 39.1
40
39
population (millions)
38
37
2010
2011
2012
2013
2014
2015
year
What is the average rate of population growth between 2010 and 2015, in million people per year?

Answers: 1


Another question on Mathematics
Mathematics, 21.06.2019 20:40
Askate shop rents roller skates as shown on the table below. which graph and function models this situation?
Answers: 1
Mathematics, 22.06.2019 01:00
Rewrite the polynomial -9x5 + 36x4 + 189x3 in factored form.
Answers: 1
Mathematics, 22.06.2019 02:30
Determine which solution is correct for solving 5/7y=6 reciprocals.
Answers: 1
You know the right answer?
The table and the graph show the population of a country between 2010 and 2015.
year population (mi...
Questions
Mathematics, 11.03.2020 04:27

Biology, 11.03.2020 04:27
Mathematics, 11.03.2020 04:27
Mathematics, 11.03.2020 04:27

Mathematics, 11.03.2020 04:27
Biology, 11.03.2020 04:27

Social Studies, 11.03.2020 04:27

Biology, 11.03.2020 04:27
Mathematics, 11.03.2020 04:27
History, 11.03.2020 04:27

Biology, 11.03.2020 04:27
Mathematics, 11.03.2020 04:27


