
Mathematics, 09.06.2021 01:00 ciarrap552
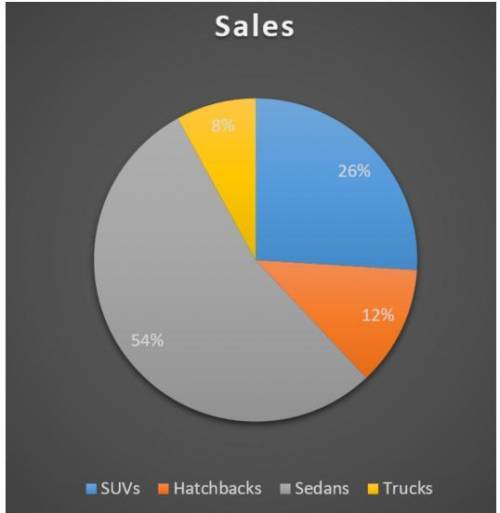
A different local dealership provides you with a chart (shown below) showing the percent of vehicles they sold categorized by vehicle type. In total, the dealership sold 250 vehicles last year. Answer the following questions.
How many of each vehicle type did the dealership sell last year?
Based on your previous calculations, how many of the vehicles sold by the dealership would you expect to be red?
Based on your previous calculations, how many of the SUVs sold would you expect to be white?

Answers: 2


Another question on Mathematics
Mathematics, 22.06.2019 00:30
Intro biblioteca sunt 462 de carti cu 198 mai putine enciclipedii si cu 47 mai multe dictionare decat enciclopedii cate enciclopedii sunt in biblioteca
Answers: 1
Mathematics, 22.06.2019 01:40
Areflection of shape i across the y-axis, followed by a , and then a translation left 6 units and down 4 units confirms congruence between shape i and shape ii. alternatively, a of shape ii about the origin, followed by a reflection across the y-axis, and then a translation right 4 units and up 6 units confirms congruence between shape ii and shape i.
Answers: 3
You know the right answer?
A different local dealership provides you with a chart (shown below) showing the percent of vehicles...
Questions


Social Studies, 17.03.2020 20:24
Mathematics, 17.03.2020 20:24
Social Studies, 17.03.2020 20:24

Mathematics, 17.03.2020 20:24

Physics, 17.03.2020 20:25
Physics, 17.03.2020 20:25
Biology, 17.03.2020 20:25

Computers and Technology, 17.03.2020 20:25


