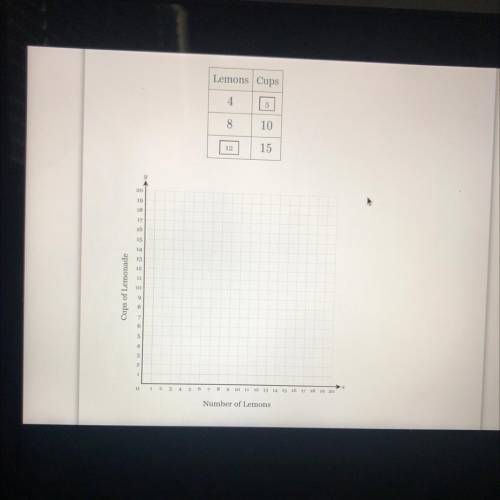
How do I graph this ? It’s a test!
...

Answers: 2


Another question on Mathematics

Mathematics, 21.06.2019 19:30
At 6 1/2 cents per pound of string beans how much does 7 pounds cost
Answers: 1
Mathematics, 21.06.2019 19:40
What is the slope of the line that contains the points (-2,1) and (0,-3)
Answers: 2
Mathematics, 21.06.2019 20:00
In new york city at the spring equinox there are 12 hours 8 minutes of daylight. the longest and shortest days of the year very by two hours and 53 minutes from the equinox in this year the equinox falls on march 21 in this task you use trigonometric function to model the hours of daylight hours on certain days of the year in new york city a.what is the independent and dependent variables? b.find the amplitude and the period of the function. c.create a trigonometric function that describes the hours of sunlight for each day of the year. d. graph the function you build in part c. e. use the function you build in part c to find out how many fewer daylight hours february 10 will have than march 21. you may look at the calendar.
Answers: 1
You know the right answer?
Questions
Mathematics, 21.08.2019 16:30

Physics, 21.08.2019 16:30

Computers and Technology, 21.08.2019 16:30
Mathematics, 21.08.2019 16:30

Social Studies, 21.08.2019 16:30

Mathematics, 21.08.2019 16:30
Mathematics, 21.08.2019 16:30

English, 21.08.2019 16:30

Health, 21.08.2019 16:30

Geography, 21.08.2019 16:30


