
Mathematics, 10.06.2021 19:10 shelbie76
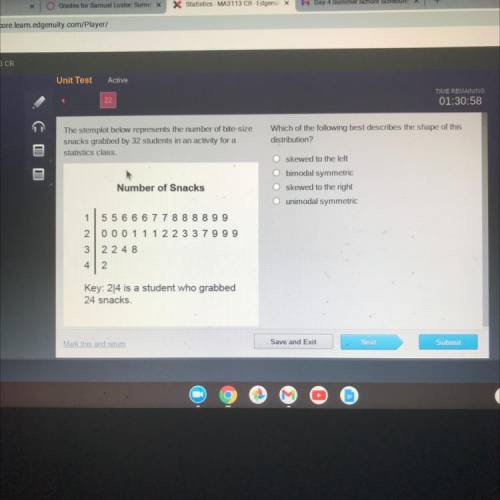
The stemplot below represents the number of bite-size
snacks grabbed by 32 students in an activity for a
statistics class.
Which of the following best describes the shape of this
distribution?
skewed to the left
bimodal symmetric
Number of Snacks
skewed to the right
unimodal symmetric
1
5 5 6 6 6 7 7 8 8 8 8 9 9
2000 1 1 1 2 2 3 3 7999
3 224 8
4 1 2
Key: 2/4 is a student who grabbed
24 snacks.

Answers: 3


Another question on Mathematics
Mathematics, 21.06.2019 20:00
Aubrey read 29 books and eli read 52 books what number is equal to the number of books aubrey read?
Answers: 1
Mathematics, 21.06.2019 21:30
Plz hurry evaluate the expression a+b where a=8 and b=19
Answers: 1
You know the right answer?
The stemplot below represents the number of bite-size
snacks grabbed by 32 students in an activity...
Questions


History, 05.10.2019 00:30

Social Studies, 05.10.2019 00:30
Mathematics, 05.10.2019 00:30


Physics, 05.10.2019 00:30

English, 05.10.2019 00:30
Mathematics, 05.10.2019 00:30
Biology, 05.10.2019 00:30
Biology, 05.10.2019 00:30
History, 05.10.2019 00:30
Mathematics, 05.10.2019 00:30


