
Mathematics, 11.06.2021 02:40 crebflower
The midterm grades for two high school algebra classes are provided in the tables below. For convenience, the data have been ordered.
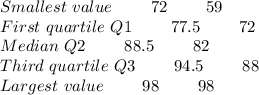
Class 1: 72 73 74 75 76 79 82 83 84 86 91
92 93 93 94 95 97 97 98 98
Class 2: 59 65 68 69 72 73 78 80 82 82
83 83 85 88 88 89 94 96 97 98
A. Sketch parallel boxplots for the two classes.
B. Which class has the better overall performance? Justify your answer.
C. The teacher for the two classes calculates a 90% confidence interval for the difference in mean midterm grades between Class #1 and Class #2. The confidence interval is (0.09299, 11.413). Assume that confidence interval conditions are met. Based on the confidence interval, do you think there is a difference in the population mean midterm grades for the two classes? Explain.

Answers: 1

![\to five\ num(Class\ 1) \\\\\[1\] \ 72.0 77.5 88.5 94.5 98.0 \\\\\to five\ num(Class\ 2) \\\\\[1\]\ 59 72 82 88 98](/tpl/images/1370/9176/1347a.png)

 Please find the graph file.
![mean \ (Class \ 1) \\\\\[1\]\ 86.5\\\\mean\ (Class\ 2)\\\\](/tpl/images/1370/9176/e867d.png)
![\[ 1 \] \ 80.80952\\\\Difference = 86.5 - 80.80952 = 5.69048](/tpl/images/1370/9176/ba743.png)


Another question on Mathematics
Mathematics, 21.06.2019 17:00
Rectangle leg this 11feet and perimeter of 38feet what is the width of the rectangle in feet
Answers: 1
Mathematics, 21.06.2019 18:00
The center of the circumscribed circle lies on line segment and the longest side of the triangle is equal to the of the circle.
Answers: 2
Mathematics, 21.06.2019 18:00
14. (05.02 lc) what is the value of y in the solution to the following system of equations? (5 points) 2x + y = −4 5x + 3y = −6
Answers: 1
You know the right answer?
The midterm grades for two high school algebra classes are provided in the tables below. For conveni...
Questions


History, 24.07.2019 19:00
Mathematics, 24.07.2019 19:00

Chemistry, 24.07.2019 19:00
Mathematics, 24.07.2019 19:00

English, 24.07.2019 19:00
Mathematics, 24.07.2019 19:00


Social Studies, 24.07.2019 19:00

Social Studies, 24.07.2019 19:00
Mathematics, 24.07.2019 19:00


