
Mathematics, 11.06.2021 04:40 jasminelockhart432
88 POINTS
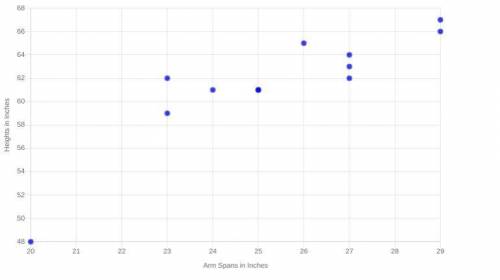
1. Which variable did you plot on the x-axis, and which variable did you plot on the y-axis? Explain why you assigned the variables in that way.
2. Write the equation of the line of best fit using the slope-intercept formula $y = mx + b$. Show all your work, including the points used to determine the slope and how the equation was determined.
3. What does the slope of the line represent within the context of your graph? What does the y-intercept represent?
4. Test the residuals of two other points to determine how well the line of best fit models the data.
5. Use the line of best fit to help you to describe the data correlation.
6. Using the line of best fit that you found in Part Three, Question 2, approximate how tall is a person whose arm span is 66 inches?
7. According to your line of best fit, what is the arm span of a 74-inch-tall person?

Answers: 1


Another question on Mathematics
Mathematics, 21.06.2019 14:00
The axis of symmetry for the graph of the function f(x)=1/4^2+bx +10 is x=6. what is the value of b?
Answers: 1
Mathematics, 21.06.2019 17:00
The rumpart family is building a new room onto their house. the width of the new room will be 16 feet. the length of the room will be 4% greater than the width. write an expression to find the length of the new room. what will be the area of this new room?
Answers: 2
Mathematics, 21.06.2019 19:00
Solve the problem. a student earned grades of c, a, b, and a in four different courses. those courses had these corresponding numbers of credit hours: 4, 5, 1, and 5. the grading system assigns quality points to letter grades as follows: a = 4, b = 3, c = 2, d = 1, and f = 0. compute the grade point average (gpa) and round the result to two decimal places. 3.40 3.50 8.75 2.18
Answers: 1
Mathematics, 21.06.2019 19:00
Identify the type of observational study described. a statistical analyst obtains data about ankle injuries by examining a hospital's records from the past 3 years. cross-sectional retrospective prospective
Answers: 2
You know the right answer?
88 POINTS
1. Which variable did you plot on the x-axis, and which variable did you plot on the y-ax...
Questions
Mathematics, 30.03.2020 00:57

History, 30.03.2020 01:07


Computers and Technology, 30.03.2020 01:07

Chemistry, 30.03.2020 01:08
Chemistry, 30.03.2020 01:08
Chemistry, 30.03.2020 01:08

Social Studies, 30.03.2020 01:08

Geography, 30.03.2020 01:08
Engineering, 30.03.2020 01:08
Social Studies, 30.03.2020 01:08


