
Mathematics, 12.06.2021 04:20 Jfhehwnxodin8398
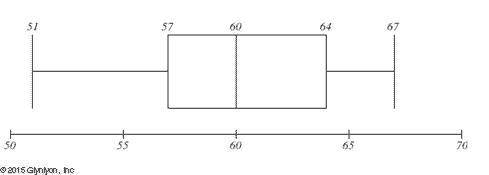
PLEASE HELP ME This box plot shows scores on a recent math test in a sixth grade class. Identify at least three things that you can infer from the box plot about the distribution’s center, variability, and spread.

Answers: 3


Another question on Mathematics
Mathematics, 21.06.2019 19:30
Weekly wages at a certain factory are normally distributed with a mean of $400 and a standard deviation of $50. find the probability that a worker selected at random makes between $450 and $500
Answers: 2
Mathematics, 21.06.2019 21:30
The expression 1.01*1.005(^t) gives the amount of money, in thousands of dollars, in carter's savings account (t) years after he opens it. what does 1.01 represent in this expression?
Answers: 1
Mathematics, 21.06.2019 21:30
High school seniors with strong academic records apply to the nation’s most selective colleges in greater numbers each year. because the number of slots remains relatively stable, some colleges reject more early applicants. suppose that for a recent admissions class, an ivy league college received 2851 applications for early admission. of this group, it admitted 1033 students early, rejected 854 outright, and deferred 964 to the regular admission pool for further consideration. in the past, this school has admitted 18% of the deferred early admission applicants during the regular admission process. counting the students admitted early and the students admitted during the regular admission process, the total class size was 2375. let e, r, and d represent the events that a student who applies for early admission is admitted early, rejected outright, or deferred to the regular admissions pool.suppose a student applies for early admission. what is the probability that the student will be admitted for early admission or be deferred and later admitted during the regular admission process?
Answers: 3
Mathematics, 22.06.2019 01:30
Have you ever been in the middle of telling a story and had to use hand gestures or even a drawing to make your point? in algebra, if we want to illustrate or visualize a key feature of a function, sometimes we have to write the function in a different form—such as a table, graph, or equation—to determine the specific key feature we’re looking for. think about interactions with others and situations you’ve come across in your own life. how have you had to adjust or change the way you represented something based on either the concept you were trying to describe or the person you were interacting with? explain how the complexity or layout of the concept required you to change your style or presentation, or how the person’s unique learning style affected the way you presented the information.
Answers: 1
You know the right answer?
PLEASE HELP ME
This box plot shows scores on a recent math test in a sixth grade class. Identify at...
Questions
Mathematics, 25.12.2019 05:31


Chemistry, 25.12.2019 05:31
Mathematics, 25.12.2019 05:31
Mathematics, 25.12.2019 05:31
Chemistry, 25.12.2019 05:31


Computers and Technology, 25.12.2019 05:31


