
Mathematics, 14.06.2021 15:40 curlyheadnikii
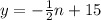
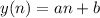
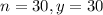
A farmer finds there is a linear relationship between the number of bean stalks, n, she plants and the yield, y, each plant produces (in ounces). When she plants 30 stalks, each plant yields 30 oz of beans. When she plants 34 stalks, each plant produces 28 oz of beans. Find an equation that gives the yield y when n stalks are planted.

Answers: 2


 . We replace this into the equation to find b. So
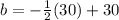


Another question on Mathematics
Mathematics, 21.06.2019 19:00
Solve the problem. a student earned grades of c, a, b, and a in four different courses. those courses had these corresponding numbers of credit hours: 4, 5, 1, and 5. the grading system assigns quality points to letter grades as follows: a = 4, b = 3, c = 2, d = 1, and f = 0. compute the grade point average (gpa) and round the result to two decimal places. 3.40 3.50 8.75 2.18
Answers: 1
Mathematics, 21.06.2019 19:20
Part a: sam rented a boat at $225 for 2 days. if he rents the same boat for 5 days, he has to pay a total rent of $480. write an equation in the standard form to represent the total rent (y) that sam has to pay for renting the boat for x days. (4 points)
Answers: 1
Mathematics, 22.06.2019 01:30
Simplify the rational expression. state any restrictions on the variable. t^2-4t-12 / t-8 the / is a fraction sign.
Answers: 1
Mathematics, 22.06.2019 03:00
Describe how the presence of possible outliers might be identified on the following. (a) histograms gap between the first bar and the rest of bars or between the last bar and the rest of bars large group of bars to the left or right of a gap higher center bar than surrounding bars gap around the center of the histogram higher far left or right bar than surrounding bars (b) dotplots large gap around the center of the data large gap between data on the far left side or the far right side and the rest of the data large groups of data to the left or right of a gap large group of data in the center of the dotplot large group of data on the left or right of the dotplot (c) stem-and-leaf displays several empty stems in the center of the stem-and-leaf display large group of data in stems on one of the far sides of the stem-and-leaf display large group of data near a gap several empty stems after stem including the lowest values or before stem including the highest values large group of data in the center stems (d) box-and-whisker plots data within the fences placed at q1 â’ 1.5(iqr) and at q3 + 1.5(iqr) data beyond the fences placed at q1 â’ 2(iqr) and at q3 + 2(iqr) data within the fences placed at q1 â’ 2(iqr) and at q3 + 2(iqr) data beyond the fences placed at q1 â’ 1.5(iqr) and at q3 + 1.5(iqr) data beyond the fences placed at q1 â’ 1(iqr) and at q3 + 1(iqr)
Answers: 1
You know the right answer?
A farmer finds there is a linear relationship between the number of bean stalks, n, she plants and t...
Questions

English, 30.10.2020 21:40

Chemistry, 30.10.2020 21:40
Mathematics, 30.10.2020 21:40

Mathematics, 30.10.2020 21:40
English, 30.10.2020 21:40

Social Studies, 30.10.2020 21:40

Mathematics, 30.10.2020 21:40

Biology, 30.10.2020 21:40
History, 30.10.2020 21:40
Mathematics, 30.10.2020 21:40
Mathematics, 30.10.2020 21:40


