
Mathematics, 14.06.2021 16:20 juliapreciiado
US
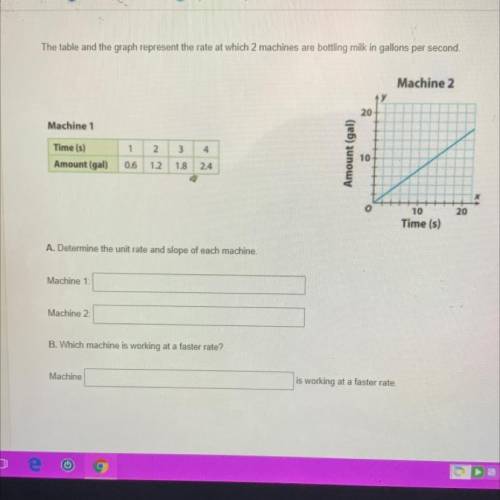
The table and the graph represent the rate at which 2 machines are bottling milk in gallons per second.
Machine 2
20
Machine 1
Time (s)
1
2
3
4
Amount (gal)
10
Amount (gal)
0.6
1.2.
1.8
2.4
o
20
10
Time (s)
A. Determine the unit rate and slope of each machine.
Machine 1:
Machine 2
B. Which machine is working at a faster rate?
Machine
is working at a faster rate.

Answers: 3


Another question on Mathematics
Mathematics, 21.06.2019 16:40
Which data set has a greater spread? why? set a: {38, 12, 23, 48, 55, 16, 18} set b: {44, 13, 24, 12, 56} has a greater spread because .
Answers: 2
Mathematics, 21.06.2019 21:30
Create a graph for the demand for starfish using the following data table: quantity/price of starfish quantity (x axis) of starfish in dozens price (y axis) of starfish per dozen 0 8 2 6 3 5 5 2 7 1 9 0 is the relationship between the price of starfish and the quantity demanded inverse or direct? why? how many dozens of starfish are demanded at a price of five? calculate the slope of the line between the prices of 6 (quantity of 2) and 1 (quantity of 7) per dozen. describe the line when there is a direct relationship between price and quantity.
Answers: 3
You know the right answer?
US
The table and the graph represent the rate at which 2 machines are bottling milk in gallons per...
Questions

Biology, 27.06.2019 15:30

English, 27.06.2019 15:30

History, 27.06.2019 15:30

English, 27.06.2019 15:30

Chemistry, 27.06.2019 15:30
Mathematics, 27.06.2019 15:30
Mathematics, 27.06.2019 15:30
Spanish, 27.06.2019 15:30
Mathematics, 27.06.2019 15:30
Mathematics, 27.06.2019 15:30
Mathematics, 27.06.2019 15:30


