
Mathematics, 14.06.2021 18:20 0Me0
PLEASE HELP AT YOUR EARLIEST CONVINECE CORRECT ANSWER GET BRAINLIEST AND 50 POINTS PLEASE HELP
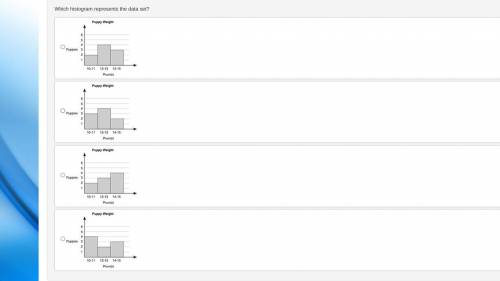
The data set below shows the weights of some puppies, in pounds, at a kennel:
10, 11, 12, 12, 13, 13, 14, 15, 15
Which histogram represents the data set?
A histogram is shown with title Puppy Weight. On the horizontal axis, the title is Pounds. The title on the vertical axis is Puppies. The range on the horizontal axis is 10 to 11, 12 to 13, and 14 to 15. The values on the vertical axis are from 0 to 6 at intervals of 1. The bar for the first range goes to 2, the bar for the second range goes to 4, the bar for the third range goes to 3.
A histogram is shown with title Puppy Weight. On the horizontal axis, the title is Pounds. The title on the vertical axis is Puppies. The range on the horizontal axis is 10 to 11, 12 to 13, and 14 to 15. The values on the vertical axis are from 0 to 6 at intervals of 1. The bar for the first range goes to 3, the bar for the second range goes to 4, the bar for the third range goes to 2.
A histogram is shown with title Puppy Weight. On the horizontal axis, the title is Pounds. The title on the vertical axis is Puppies. The range on the horizontal axis is 10 to 11, 12 to 13, and 14 to 15. The values on the vertical axis are from 0 to 6 at intervals of 1. The bar for the first range goes to 2, the bar for the second range goes to 3, the bar for the third range goes to 4.
A histogram is shown with title Puppy Weight. On the horizontal axis, the title is Pounds. The title on the vertical axis is Puppies. The range on the horizontal axis is 10 to 11, 12 to 13, and 14 to 15. The values on the vertical axis are from 0 to 6 at intervals of 1. The bar for the first range goes to 4, the bar for the second range goes to 2, the bar for the third range goes to 3.
I ATTACHED A PICTURE OF THE GRAPH ANSWER CHOICES FOR BETTER UNDERSTANDING
Thank you have a wonderful day :) (dont stress over this just try your hardest)

Answers: 2


Another question on Mathematics
Mathematics, 21.06.2019 19:30
Acar started driving from city a to city b, distance between which is 620 miles, at a rate of 60 mph. two hours later a truck left city b and started moving towards city a at a rate of 40 mph. what distance from city a is the point where the truck and the car will meet?
Answers: 1
Mathematics, 21.06.2019 21:00
Dean and karlene get paid to write songs. dean is paid a one-time fee of $20 plus $80 per day. karlene is paid a one-time fee of $25 plus $100 per day. write an expression to represent how much a producer will pay to hire both to work the same number of days on a song.
Answers: 1
Mathematics, 21.06.2019 22:30
The party planning committee has to determine the number of tables needed for an upcoming event. if a square table can fit 8 people and a round table can fit 6 people, the equation 150 = 8x + 6y represents the number of each type of table needed for 150 people.
Answers: 1
Mathematics, 22.06.2019 00:30
A10 inch cookie cake is divided into 8 slices. what is the area of 3 slices
Answers: 1
You know the right answer?
PLEASE HELP AT YOUR EARLIEST CONVINECE CORRECT ANSWER GET BRAINLIEST AND 50 POINTS PLEASE HELP
The...
Questions
Mathematics, 21.04.2021 22:20
Mathematics, 21.04.2021 22:20

Spanish, 21.04.2021 22:20


Advanced Placement (AP), 21.04.2021 22:20


Chemistry, 21.04.2021 22:20
Mathematics, 21.04.2021 22:20
Mathematics, 21.04.2021 22:20

Spanish, 21.04.2021 22:20
Mathematics, 21.04.2021 22:20
Mathematics, 21.04.2021 22:20
English, 21.04.2021 22:20


