
Mathematics, 15.06.2021 18:00 tinatis
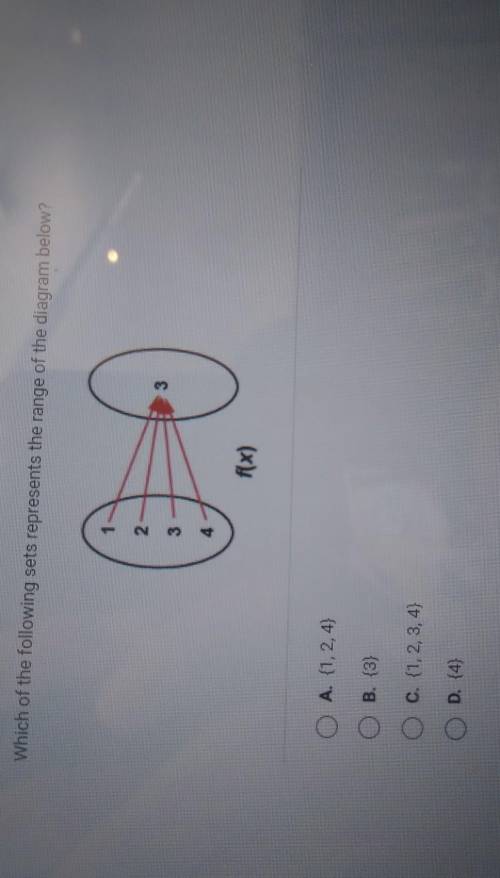
Which of the following sets represents the range of the diagram below? 2 3 3 A. {1,2,4) B. {3} C. {1,2,3,4} D. {4}

Answers: 2


Another question on Mathematics
Mathematics, 21.06.2019 20:30
3.17 scores on stats final. below are final exam scores of 20 introductory statistics students. 1 2 3 4 5 6 7 8 9 10 11 12 13 14 15 16 17 18 19 20 57, 66, 69, 71, 72, 73, 74, 77, 78, 78, 79, 79, 81, 81, 82, 83, 83, 88, 89, 94 (a) the mean score is 77.7 points. with a standard deviation of 8.44 points. use this information to determine if the scores approximately follow the 68-95-99.7% rule. (b) do these data appear to follow a normal distribution? explain your reasoning using the graphs provided below.
Answers: 1
Mathematics, 21.06.2019 23:00
Can someone me with my math problems i have a bunch. i will give brainliest and lots of pleeeaaasssee
Answers: 2
Mathematics, 21.06.2019 23:00
Solve for n. round to the tenths place, if necessary. 14.2 cups of flour6 loaves of bread= 20 cups of flour n
Answers: 2
You know the right answer?
Which of the following sets represents the range of the diagram below? 2 3 3 A. {1,2,4) B. {3} C. {1...
Questions


Mathematics, 29.10.2020 16:40


