
Mathematics, 16.06.2021 01:00 roserose3098
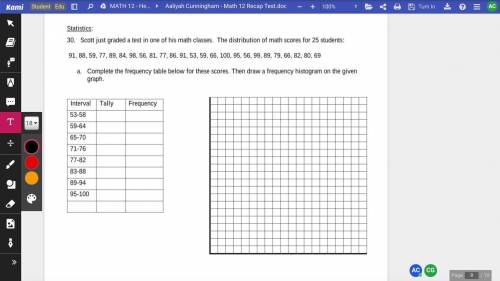
Scott just graded a test in one of his math classes. The distribution of math scores for 25 students: 91, 88, 59, 77, 89, 84, 98, 56, 81, 77, 86, 91, 53, 59, 66, 100, 95, 56, 99, 89, 79, 66, 82, 80, 69 a. Complete the frequency table below for these scores. Then draw a frequency histogram on the given graph.
Interval:
53-58
59-64
65-70
71-76
77-82
83-88
89-94
95-100
Tally:
Frequency:

Answers: 1


Another question on Mathematics
Mathematics, 21.06.2019 20:30
I’m on question 7 it says a covered water tank is in the shape of a cylinder the tank has a 28 inch diameter and a height of 66 inches to the nearest square inch what is the surface area of the water tank
Answers: 2
Mathematics, 21.06.2019 22:00
Tom drove 206 miles in 3.9 hours. estimate his average speed.
Answers: 2
You know the right answer?
Scott just graded a test in one of his math classes. The distribution of math scores for 25 students...
Questions

History, 10.03.2020 17:31
History, 10.03.2020 17:31


Computers and Technology, 10.03.2020 17:31
Mathematics, 10.03.2020 17:31

History, 10.03.2020 17:31


