Which graph represents the solution set for the inequality 1xs 18?
2
+++
0 1 2
3...

Mathematics, 18.06.2021 07:40 radusevciuc7719
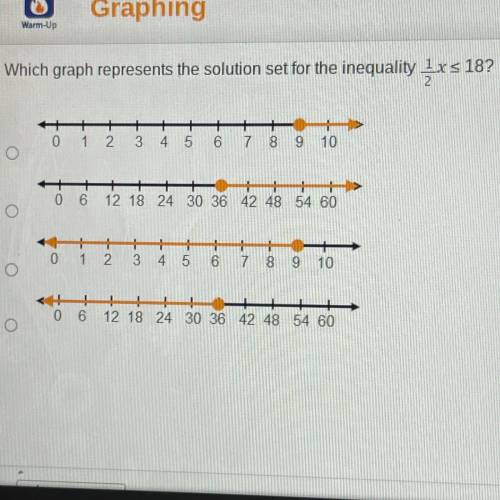
Which graph represents the solution set for the inequality 1xs 18?
2
+++
0 1 2
3 4 5 6 7 8 9 10
>
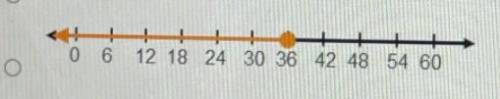
+++
0 6 12 18 24 30 36 42 48 54 60
+
0 1 2 3 4 5 6 7 8 9 10
0 6 12 18 24 30 36 42 48 54 60

Answers: 1


Another question on Mathematics
Mathematics, 21.06.2019 14:40
Consider the table below. x y -1 -5 0 5 1 11 2 13 3 11 complete the standard form equation representing the quadratic relationship displayed above, where a, b, and c are constants.
Answers: 2
Mathematics, 21.06.2019 17:30
Enter the missing numbers in the boxes to complete the table of equivalent ratios.time (min) distance (km)? 36 9? 1512 ?
Answers: 3
Mathematics, 21.06.2019 19:00
Which of the expressions (on the photo document i inserted) together represent all solutions to the following equation? 8cos(12x)+4=-4 *the answer should be in degrees.* > i would like for someone to explain the process to find the solutions for this.
Answers: 2
Mathematics, 21.06.2019 22:00
Asquare and an equilateral triangle have the same perimeter. each side the triangle is 4 inches longer than each side of the square. what is the perimeter of the square
Answers: 1
You know the right answer?
Questions

Mathematics, 02.12.2021 21:10

Chemistry, 02.12.2021 21:10
Mathematics, 02.12.2021 21:10
SAT, 02.12.2021 21:10

Mathematics, 02.12.2021 21:10
Chemistry, 02.12.2021 21:10

Mathematics, 02.12.2021 21:10


