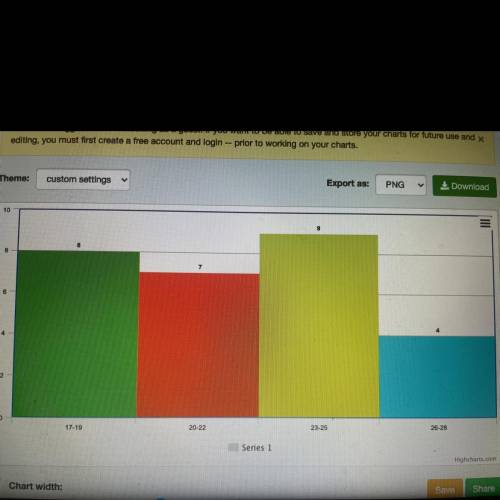
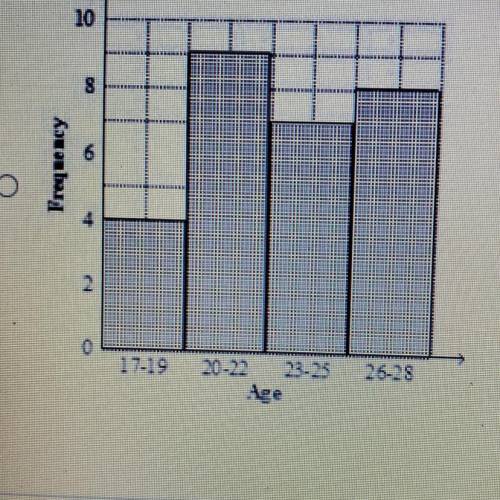
Make a histogram for drivers' ages using the data from the table below.
Driver’s Ages
Age F...

Mathematics, 21.06.2021 07:10 natalie2sheffield
Make a histogram for drivers' ages using the data from the table below.
Driver’s Ages
Age Frequency
17-19 8
20-22 7
23-25 9
26-28 4

Answers: 1


Another question on Mathematics
Mathematics, 21.06.2019 21:30
If t17 = 3 (t5) in an arithmetic progression, find t1 in terms of d.
Answers: 1
You know the right answer?
Questions


English, 19.04.2021 21:40
Mathematics, 19.04.2021 21:40
Biology, 19.04.2021 21:40


Physics, 19.04.2021 21:40
Mathematics, 19.04.2021 21:40


Computers and Technology, 19.04.2021 21:40
Mathematics, 19.04.2021 21:40

Social Studies, 19.04.2021 21:40
Mathematics, 19.04.2021 21:40
Mathematics, 19.04.2021 21:40
Physics, 19.04.2021 21:40


