
Mathematics, 22.06.2021 14:00 OfficallyRobloxedd
A. Assimilation (Time Frame: Day 4 )
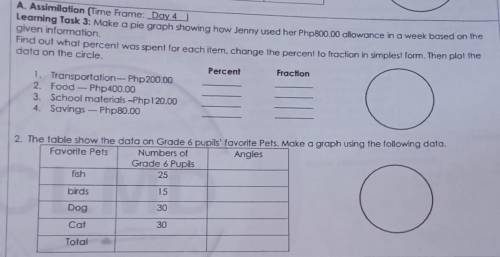
Learning Task 3: Make a pie graph showing how Jenny used her Php800.00 allowance in a week based on the
given information.
Find out what percent was spent for each item, change the percent to fraction in simplest form. Then plot the
data on the circle.
Percent
Fraction
1. Transportation-- Php200.00
2. Food -- Php 400.00
3. School materials -Php120.00
4. Savings - Php 80.00
2. The table show the data on Grade 6 pupils' favorite Pets. Make a graph using the following data.
Favorite Pets
Angles
Numbers of
Grade 6 Pupils
25
fish
birds
15
Dog
30
Cat
30
Total

Answers: 1


Another question on Mathematics
Mathematics, 20.06.2019 18:02
Ineed with 14, 16, 28 and 36 me. we didn't go over them in class so i don't know what to do.
Answers: 1
Mathematics, 21.06.2019 19:00
Analyze the graph of the cube root function shown on the right to determine the transformations of the parent function. then, determine the values of a, h, and k in the general equation. y=a3x-h+k h= . k= done 000000l o 7 of 8
Answers: 2
Mathematics, 21.06.2019 20:00
What is the ratio of the length of an object in yards to the length of the same object in miles?
Answers: 3
Mathematics, 21.06.2019 20:30
Ming says that 0.24 > 1/4 because 0.24= 2/4. which best explains mings error
Answers: 1
You know the right answer?
A. Assimilation (Time Frame: Day 4 )
Learning Task 3: Make a pie graph showing how Jenny used her P...
Questions


Mathematics, 23.06.2019 23:30
Mathematics, 23.06.2019 23:30


Advanced Placement (AP), 23.06.2019 23:30
Mathematics, 23.06.2019 23:30
Mathematics, 23.06.2019 23:30
Mathematics, 23.06.2019 23:30


