
Mathematics, 22.06.2021 20:50 jordan5778
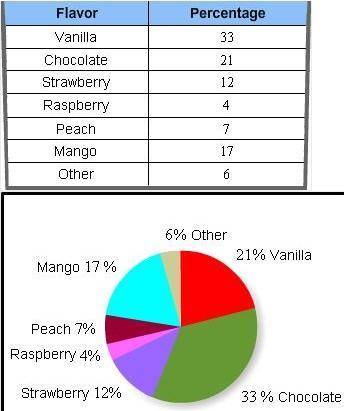
The following Circle Graph and table show the result of the survey conducted by Twin Groves Ice Cream parlor to find out the most popular ice cream flavor.
How does the Circle Graph misrepresent the data in the table?
A. Raspberry is the least popular flavor.
B. The two larger sections of the graph are not labeled correctly.
C. One of the flavors from the table is missing in the Circle Chart.
D. Peach is the next popular flavor after strawberry.

Answers: 1


Another question on Mathematics
Mathematics, 21.06.2019 19:30
If (17, 4) is an ordered pair of the inverse of f(x), which of the following is an ordered pair of the function f(x)? a. (17,4) b. (4.17) c. (4,0) d. 0,17)
Answers: 2
Mathematics, 21.06.2019 22:00
Astudent has created the give circuit diagram. it consists of a battery, a resistor, and a light bulb. in one minute, 1.2c of charge flows through the resistor. how much charge flows through the light bulb in one minute?
Answers: 1
Mathematics, 21.06.2019 22:30
Abag contains 10 white golf balls and 6 striped golf balls. a golfer wants to add 112 golf balls to the bag. he wants the ratio of white to striped gold balls to remain the same. how many of each should he add?
Answers: 2
You know the right answer?
The following Circle Graph and table show the result of the survey conducted by Twin Groves Ice Crea...
Questions

World Languages, 15.06.2021 19:50

Chemistry, 15.06.2021 19:50

Physics, 15.06.2021 19:50
Mathematics, 15.06.2021 19:50


Biology, 15.06.2021 19:50
Social Studies, 15.06.2021 19:50
Mathematics, 15.06.2021 19:50
Mathematics, 15.06.2021 19:50
Social Studies, 15.06.2021 19:50

English, 15.06.2021 19:50

History, 15.06.2021 19:50


