
Mathematics, 22.06.2021 22:30 caitlin89
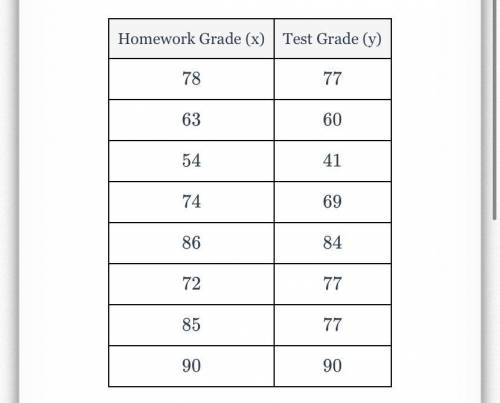
A mathematics teacher wanted to see the correlation between test scores and homework. The homework grade (x) and test grade (y) are given in the accompanying table. Write the linear regression equation that represents this set of data, rounding all coefficients to the nearest tenth. Using this equation, find the projected test grade, to the nearest integer, for a student with a homework grade of 34. SOMEONE HELP ME WITH THIS RIGHT NOW. please

Answers: 3


Another question on Mathematics
Mathematics, 21.06.2019 17:00
The table shows population statistics for the ages of best actor and best supporting actor winners at an awards ceremony. the distributions of the ages are approximately bell-shaped. compare the z-scores for the actors in the following situation. best actor best supporting actor muequals42.0 muequals49.0 sigmaequals7.3 sigmaequals15 in a particular year, the best actor was 59 years old and the best supporting actor was 45 years old. determine the z-scores for each. best actor: z equals best supporting actor: z equals (round to two decimal places as needed.) interpret the z-scores. the best actor was (more than 2 standard deviations above more than 1 standard deviation above less than 1 standard deviation above less than 2 standard deviations below) the mean, which (is not, is) unusual. the best supporting actor was (less than 1 standard deviation below more than 1 standard deviation above more than 2 standard deviations below more than 1 standard deviation below) the mean, which (is is not) unusual.
Answers: 1
Mathematics, 21.06.2019 18:30
Apsychology student wishes to investigate differences in political opinions between business majors and political science majors at her college. she randomly selects 100 students from the 260 business majors and 100 students from the 180 political science majors. does this sampling plan result in a simple random sample? why or why not? no, because each group of 200 students in the sample does not have the same chance of being selected. yes, because each group of 200 students in the sample has the same chance of being selected. no, because each individual student does not have an equal chance of being selected. yes, because each individual student has the same chance of being selected.
Answers: 1
Mathematics, 21.06.2019 18:50
If sr is 4.5cm and tr is 3cm, what is the measure in degrees of angle s?
Answers: 2
You know the right answer?
A mathematics teacher wanted to see the correlation between test scores and homework. The homework g...
Questions

Business, 18.07.2019 00:00


Health, 18.07.2019 00:00

Biology, 18.07.2019 00:00
History, 18.07.2019 00:00

Social Studies, 18.07.2019 00:00
Mathematics, 18.07.2019 00:00

Mathematics, 18.07.2019 00:00

Chemistry, 18.07.2019 00:00
Mathematics, 18.07.2019 00:00


