
Mathematics, 23.06.2021 17:10 raweber
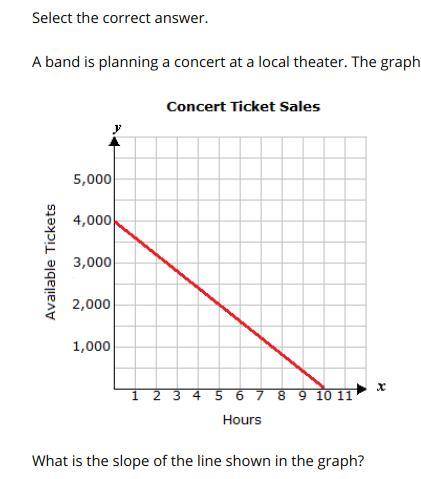
A band is planning a concert at a local theater. The graph below shows the ticket sales per hour.
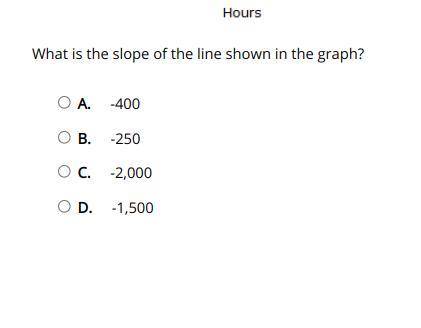
What is the slope of the line shown in the graph?
A.
-400
B.
-250
C.
-2,000
D.
-1,500

Answers: 2


Another question on Mathematics
Mathematics, 21.06.2019 20:00
If benito is selecting samples of five values from the table, which row will result in the greatest mean? population data row 1 4 2 2 3 3 row 2 3 3 4 3 2 row 3 2 4 3 4 3 row 4 3 4 4 7 3 row 1 row 2 r
Answers: 1
Mathematics, 22.06.2019 02:40
21 type the correct answer in each box. if necessary, round your answers to the nearest hundredth the vertices of abc are a(2,8), b(16, 2), and c(6,2). the perimeter of abc is units, and its area is square units
Answers: 2
Mathematics, 22.06.2019 02:50
The graph of f(x) shown below has the same shape as the graph of g(x)=x^3-x^2 but it is shifted to the left 2 units what is its equation
Answers: 2
Mathematics, 22.06.2019 03:00
Which angle of rotation is an angle of rotational symmetry for all figures?
Answers: 2
You know the right answer?
A band is planning a concert at a local theater. The graph below shows the ticket sales per hour.
W...
Questions
SAT, 29.11.2021 19:50

Biology, 29.11.2021 19:50
Mathematics, 29.11.2021 19:50
Mathematics, 29.11.2021 19:50

Mathematics, 29.11.2021 19:50

Biology, 29.11.2021 19:50

Mathematics, 29.11.2021 19:50
Biology, 29.11.2021 19:50
English, 29.11.2021 19:50
Mathematics, 29.11.2021 19:50
Biology, 29.11.2021 19:50

Business, 29.11.2021 19:50

History, 29.11.2021 19:50
Mathematics, 29.11.2021 19:50

Mathematics, 29.11.2021 19:50


