
Mathematics, 24.06.2021 14:00 Cinders13
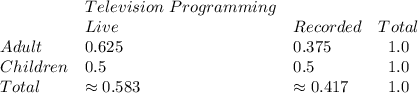
The conditional relative frequency table was calculated by row using data from a survey of one station’s television programming. The survey compared the target audience with the type of show, either live or recorded, over a 24-hour time period.
A 4-column table with 3 rows titled television programming. The first column has no label with entries adult, children, total. The second column is labeled live with entries 0.625, 0.5, nearly equal to 0.583. The third column is labeled recorded with entries 0.375, 0.5, nearly equal to 0.417. The fourth column is labeled total with entries 1.0, 1.0, 1.0.
Which is the best description of the value 0.375 in the table?
Given that the program was targeted at adults, there is a 37.5% chance that it was recorded.
Given that the program was recorded, there is a 37.5% chance that it was targeted at adults.
37.5% of the programs are targeted at adults.
37.5% of the programs are recorded.

Answers: 1


Another question on Mathematics
Mathematics, 21.06.2019 20:00
The distribution of the amount of money spent by students for textbooks in a semester is approximately normal in shape with a mean of $235 and a standard deviation of $20. according to the standard deviation rule, how much did almost all (99.7%) of the students spend on textbooks in a semester?
Answers: 2
Mathematics, 22.06.2019 00:20
In the next 10 years, how do you think hipaa guidelines will affect the roles, responsibilities and tools of a medical transcriptionist
Answers: 1
Mathematics, 22.06.2019 00:30
Intro biblioteca sunt 462 de carti cu 198 mai putine enciclipedii si cu 47 mai multe dictionare decat enciclopedii cate enciclopedii sunt in biblioteca
Answers: 1
Mathematics, 22.06.2019 01:00
The price for gasoline is represented by the equation y=3.69x, where y represents the total price for x gallons of gasoline. on a graph, the number of gallons is represented on the horizontal axis, and the total price is represented on the vertical axis. determine whether each statement describes the graph of the equation. select true or false for each statement
Answers: 2
You know the right answer?
The conditional relative frequency table was calculated by row using data from a survey of one stati...
Questions
Mathematics, 30.11.2020 19:20


English, 30.11.2020 19:20
Mathematics, 30.11.2020 19:20
Mathematics, 30.11.2020 19:20
Mathematics, 30.11.2020 19:20

History, 30.11.2020 19:20
Mathematics, 30.11.2020 19:20

Biology, 30.11.2020 19:20
Biology, 30.11.2020 19:20


