
Mathematics, 24.06.2021 22:00 alidalostimolo
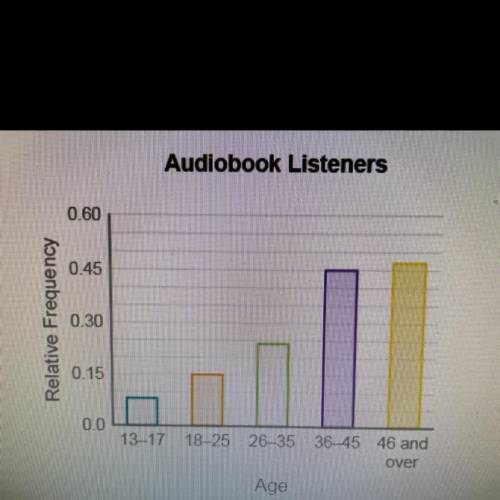
People of different ages were asked the question "Do
you listen to audiobooks?" The bar chart displays the
percentage of "yes" responses in each age group.
Would it be appropriate to display the data with a pie
chart?
No, because the proportions are not parts of a whole.
No, because the data categories are too broad.
Yes, because the data are grouped into categories.
Yes, because the data can be represented by a
relative frequency compared to the whole.

Answers: 3


Another question on Mathematics
Mathematics, 21.06.2019 17:30
Which of the following is correct interpretation of the expression -4+13
Answers: 2
Mathematics, 21.06.2019 18:30
Astick 2 m long is placed vertically at point b. the top of the stick is in line with the top of a tree as seen from point a, which is 3 m from the stick and 30 m from the tree. how tall is the tree?
Answers: 2
Mathematics, 21.06.2019 19:30
If chord ab is congruent to chord cd, then what must be true about ef and eg?
Answers: 1
Mathematics, 21.06.2019 20:30
Solve each quadratic equation by factoring and using the zero product property. x^2 - 8x + 30 = 3x
Answers: 2
You know the right answer?
People of different ages were asked the question "Do
you listen to audiobooks?" The bar chart displ...
Questions

English, 13.02.2021 02:00
Mathematics, 13.02.2021 02:00
Mathematics, 13.02.2021 02:00


Social Studies, 13.02.2021 02:00
Mathematics, 13.02.2021 02:00
Mathematics, 13.02.2021 02:00

Physics, 13.02.2021 02:00
Mathematics, 13.02.2021 02:00

Physics, 13.02.2021 02:00


