
Mathematics, 28.06.2021 01:30 lychee1406
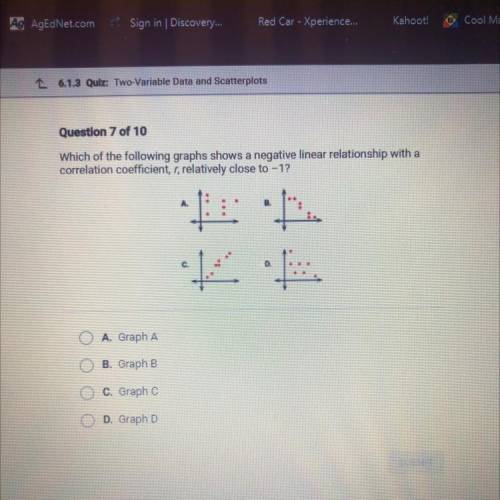
Help me please Which of the following graphs shows a negative linear relationship with a
correlation coefficient, r, relatively close to -1?
A
В.
C
D
A. Graph A.
B. Graph B
C. Graph C
D. Graph D

Answers: 3


Another question on Mathematics
Mathematics, 21.06.2019 18:30
At the olympic games, many events have several rounds of competition. one of these events is the men's 100-meter backstroke. the upper dot plot shows the times (in seconds) of the top 8 finishers in the final round of the 2012 olympics. the lower dot plot shows the times of the same 8 swimmers, but in the semifinal round. which pieces of information can be gathered from these dot plots? (remember that lower swim times are faster.) choose all answers that apply: a: the swimmers had faster times on average in the final round. b: the times in the final round vary noticeably more than the times in the semifinal round. c: none of the above.
Answers: 2
Mathematics, 21.06.2019 19:00
The fence around a quadrilateral-shaped pasture is 3a^2+15a+9 long. three sides of the fence have the following lengths: 5a, 10a-2, a^2-7. what is the length of the fourth side of the fence?
Answers: 1
Mathematics, 22.06.2019 02:30
What is the output, or dependent variable of quantity? 1: x 2: f(x) 3: y
Answers: 1
Mathematics, 22.06.2019 05:00
April carriers 5 suitcases to car. each suitcases weighs 6 1/2 pounds. how many pounds does april carry in all
Answers: 1
You know the right answer?
Help me please Which of the following graphs shows a negative linear relationship with a
correlatio...
Questions

Spanish, 26.01.2022 14:00


English, 26.01.2022 14:00
Mathematics, 26.01.2022 14:00


History, 26.01.2022 14:00

Biology, 26.01.2022 14:00


