
Mathematics, 28.06.2021 01:50 lelen2021
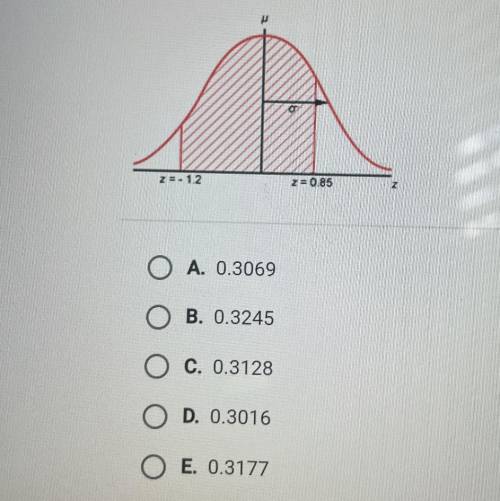
The standard normal curve shown below models the population distribution of a random variable. What proportion of the values in the population does not lie between the two z-scores indicated on the diagram?
A. 0.3069
B. 0.3245
C. 0.3128
D. 0.3016
E. 0.3177

Answers: 3


Another question on Mathematics
Mathematics, 21.06.2019 19:30
Bob is putting books on a shelf and takes a break after filling 18 1/2 inches on the book shelf. the book shelf is now 2/3 full. how long is the entire bookshelf?
Answers: 2
You know the right answer?
The standard normal curve shown below models the population distribution of a random variable. What...
Questions

Mathematics, 27.08.2021 01:00


English, 27.08.2021 01:00
Biology, 27.08.2021 01:00

History, 27.08.2021 01:00
English, 27.08.2021 01:00


