
Mathematics, 03.07.2021 22:00 mmmmm96061
PLEAAASE ASAP!
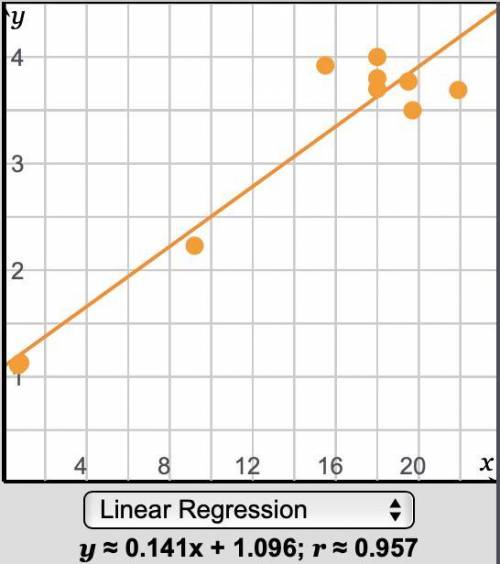
a) Describe how the line of best fit and the correlation coefficient can be used to determine the correlation between the two variables on your graph.
b) Describe the type of correlation between the two variables on your graph. How do you know?
c) Does the correlation between the variables imply causation? Explain.
d) How do you calculate the residuals for a scatterplot?
e) Calculate the residuals for your scatterplot in step 2d.
f) Create a residual plot for your data.
g) Does your residual plot show that the linear model from the regression calculator is a good model? Explain your reasoning.
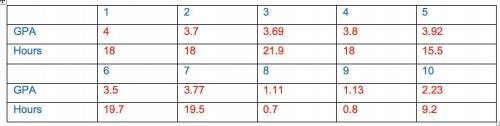
Graph&data are attached

Answers: 1


Another question on Mathematics
Mathematics, 21.06.2019 19:00
Since opening night, attendance at play a has increased steadily, while attendance at play b first rose and then fell. equations modeling the daily attendance y at each play are shown below, where x is the number of days since opening night. on what day(s) was the attendance the same at both plays? what was the attendance? play a: y = 8x + 191 play b: y = -x^2 + 26x + 126 a. the attendance was never the same at both plays. b. the attendance was the same on day 5. the attendance was 231 at both plays on that day. c. the attendance was the same on day 13. the attendance was 295 at both plays on that day. d. the attendance was the same on days 5 and 13. the attendance at both plays on those days was 231 and 295 respectively.
Answers: 1
Mathematics, 22.06.2019 00:30
If you were constructing a triangular frame, and you had wood in the length of 4inches, 4 inches, and 7 inches, would it make a triangle? would you be able to create a frame from these pieces of wood? yes or no. explain your mathematical thinking
Answers: 2
Mathematics, 22.06.2019 01:00
1) your friend taylor missed class today and needs some identifying solutions of systems. explain to taylor where to find the solution(s) of any system using its graph 2)taylor graphs the following in desmos and decides that f(x) = g(x) at x = 0, x = 1, & x = 3. f(x) = 2x+1g(x) = 2x2+1 provide taylor some feedback that explains which part of the answer was incorrect and why.
Answers: 1
Mathematics, 22.06.2019 02:00
1. the manager of collins import autos believes the number of cars sold in a day (q) depends on two factors: (1) the number of hours the dealership is open (h) and (2) the number of salespersons working that day (s). after collecting data for two months (53 days), the manager estimates the following log-linear model: q 4 equation 1 a. explain, how to transform the log-linear model into linear form that can be estimated using multiple regression analysis. the computer output for the multiple regression analysis is shown below: q4 table b. how do you interpret coefficients b and c? if the dealership increases the number of salespersons by 20%, what will be the percentage increase in daily sales? c. test the overall model for statistical significance at the 5% significance level. d. what percent of the total variation in daily auto sales is explained by this equation? what could you suggest to increase this percentage? e. test the intercept for statistical significance at the 5% level of significance. if h and s both equal 0, are sales expected to be 0? explain why or why not? f. test the estimated coefficient b for statistical significance. if the dealership decreases its hours of operation by 10%, what is the expected impact on daily sales?
Answers: 2
You know the right answer?
PLEAAASE ASAP!
a) Describe how the line of best fit and the correlation coefficient can be used to...
Questions
Mathematics, 22.12.2021 05:30


Computers and Technology, 22.12.2021 05:30

Biology, 22.12.2021 05:30

SAT, 22.12.2021 05:40
Computers and Technology, 22.12.2021 05:40
Mathematics, 22.12.2021 05:40
Biology, 22.12.2021 05:40

Physics, 22.12.2021 05:40

Social Studies, 22.12.2021 05:40


