
Mathematics, 06.07.2021 19:50 meganwintergirl
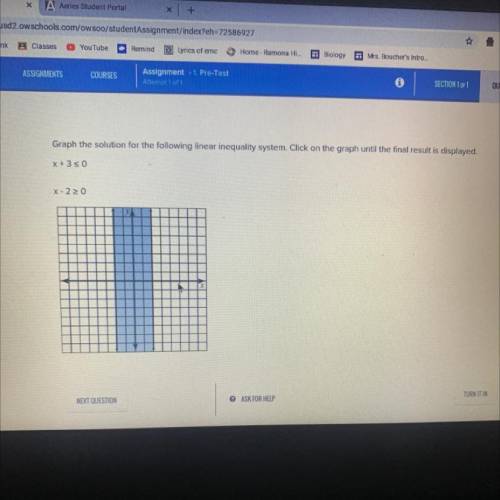
Graph the solution for the following linear inequality system. Click on the graph until the final result is displayed.
x+3 <_0
X-2>_0

Answers: 3


Another question on Mathematics
Mathematics, 21.06.2019 16:00
The scatter plot graph shows the average annual income for a certain profession based on the number of years of experience which of the following is most likely to be the equation of the trend line for this set of data? a. i=5350e +37100 b. i=5350e-37100 c. i=5350e d. e=5350e+37100
Answers: 1
Mathematics, 21.06.2019 16:00
On saturday morning, calls arrive at ticketmaster at a rate of 108 calls per hour. what is the probability of fewer than three calls in a randomly chosen minute?
Answers: 1
Mathematics, 21.06.2019 17:30
1. if we have 3 babies what is the probability they’re going to be all boys? 2. if we roll 2 die at the same time what is the probability of getting less than 10 on the first roll and a 5 on the second roll 3. if we have 3 babies what is the probability their is going to be 2 girls? 4. if we have 3 babies what is the probability of having no more than 1 girl? 5. it we have 3 babies and then have another 3 babies what is the probability of us having at least 1 boy and then having all girls?
Answers: 1
You know the right answer?
Graph the solution for the following linear inequality system. Click on the graph until the final re...
Questions

History, 21.10.2019 14:30
History, 21.10.2019 14:30

Chemistry, 21.10.2019 14:30
Mathematics, 21.10.2019 14:30

Social Studies, 21.10.2019 14:30
Mathematics, 21.10.2019 14:30


Biology, 21.10.2019 14:30

English, 21.10.2019 14:30
Mathematics, 21.10.2019 14:30
Mathematics, 21.10.2019 14:30


