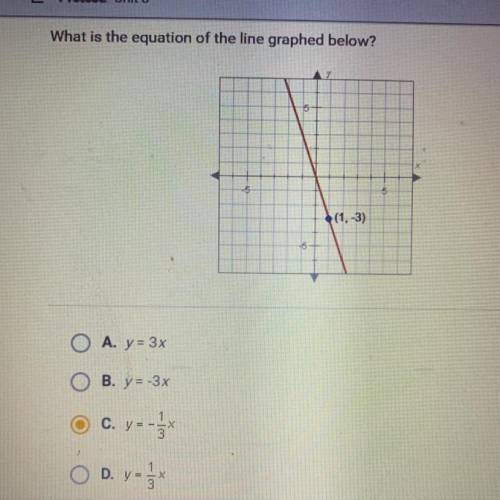
What is the equation of the line graphed below?
5
-5
5
(1, -3)
-5
O A...

Mathematics, 07.07.2021 08:20 sandy461
What is the equation of the line graphed below?
5
-5
5
(1, -3)
-5
O A. y = 3x
B. y=-3x
c. y=-5
D. y =
-X

Answers: 3


Another question on Mathematics
Mathematics, 21.06.2019 21:00
When george started his current job, his employer told him that at the end of the first year, he would receive two vacation days. after each year worked, his number of vacation days will double up to five work weeks (25days) of payed vacation. how many vacation days will he have in 4 years
Answers: 1
Mathematics, 21.06.2019 21:20
The edge of a cube was found to be 30 cm with a possible error in measurement of 0.4 cm. use differentials to estimate the maximum possible error, relative error, and percentage error in computing the volume of the cube and the surface area of the cube. (round your answers to four decimal places.) (a) the volume of the cube maximum possible error cm3 relative error percentage error % (b) the surface area of the cube maximum possible error cm2 relative error percentage error %
Answers: 3
Mathematics, 21.06.2019 21:30
Name and describe the three most important measures of central tendency. choose the correct answer below. a. the mean, sample size, and mode are the most important measures of central tendency. the mean of a data set is the sum of the observations divided by the middle value in its ordered list. the sample size of a data set is the number of observations. the mode of a data set is its highest value in its ordered list. b. the sample size, median, and mode are the most important measures of central tendency. the sample size of a data set is the difference between the highest value and lowest value in its ordered list. the median of a data set is its most frequently occurring value. the mode of a data set is sum of the observations divided by the number of observations. c. the mean, median, and mode are the most important measures of central tendency. the mean of a data set is the product of the observations divided by the number of observations. the median of a data set is the lowest value in its ordered list. the mode of a data set is its least frequently occurring value. d. the mean, median, and mode are the most important measures of central tendency. the mean of a data set is its arithmetic average. the median of a data set is the middle value in its ordered list. the mode of a data set is its most frequently occurring value.
Answers: 3
Mathematics, 21.06.2019 22:40
The value of x in this system of equations is 1. 3x + y = 9 y = –4x + 10 substitute the value of y in the first equation: combine like terms: apply the subtraction property of equality: apply the division property of equality: 3x + (–4x + 10) = 9 –x + 10 = 9 –x = –1 x = 1 what is the value of y?
Answers: 1
You know the right answer?
Questions


Mathematics, 22.10.2020 16:01


