
Mathematics, 11.07.2021 07:40 P4thing
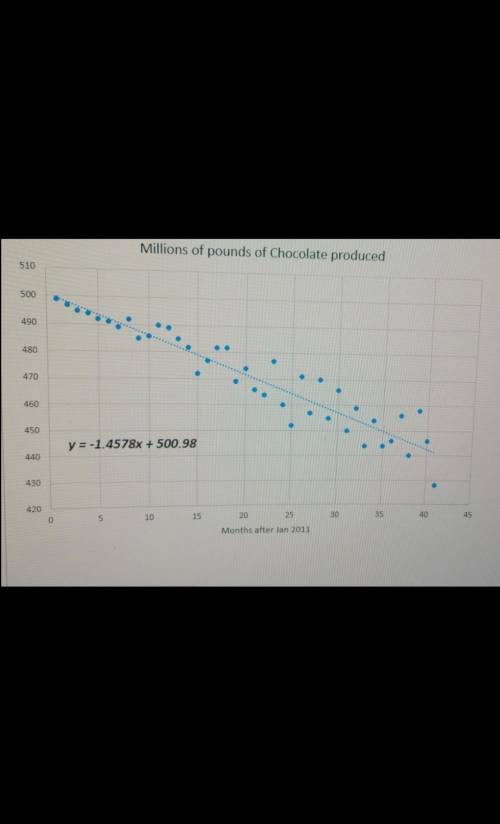
Using the graph below, what prediction is expected using the trendline for 15 months after Jan 2011?

Answers: 1


Another question on Mathematics
Mathematics, 21.06.2019 17:00
The sum of the reciprocal of a positive number and the reciprocal of 2 more than the number is 3/4 equation: the number is
Answers: 2
Mathematics, 21.06.2019 22:00
Billie holiday sells children's clothing for sara vaughn's toddler shop. baby blankets sell for $29.99 after a markup rate based on cost of 109%. find the cost and the markup.
Answers: 2
Mathematics, 22.06.2019 00:00
The statements below can be used to prove that the triangles are similar. ? △abc ~ △xyz by the sss similarity theorem. which mathematical statement is missing? ∠b ≅ ∠y ∠b ≅ ∠z
Answers: 3
Mathematics, 22.06.2019 00:30
Select the correct answer. employee earnings per month($) 1 1,200 2 2,600 3 1,800 4 1,450 5 3,500 6 2,800 7 12,500 8 3,200 which measure of spread is best for the data in the table? a. range b. quartiles c. interquartile range d. mean absolute deviation
Answers: 2
You know the right answer?
Using the graph below, what prediction is expected using the trendline for 15 months after Jan 2011?...
Questions


