
Mathematics, 13.07.2021 06:20 joshuaburge13
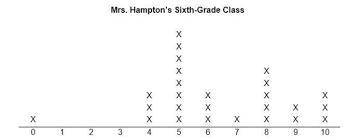
A survey was conducted to determine how many movies were seen in one month among the students
in Mrs. Hampton’s sixth-grade class. The results are shown in the dot plot below.
Step 1: Calculate the measures of center for Mrs. Hampton's data in the dot plot (round your
answer to the nearest tenths place). Show your work and briefly explain each step. (Measures of
Center are the Mean and Median of a data set)
Step 2: Calculate the measures of SPREAD for rs. Hampton's data in the dot plot. Show your work
and briefly explain each step. Measures of Spread are Range, IQR (Inter-Quartile Range) and
Mean Absolute Deviation.
Step 3: Collect and Record Your own data! Ask exactly 25 people the same question as above
(How many movies did you see in the last month). Record your data and Create a dot plot showing
your results.
Step 4: Calculate the measures of center for your data set (mean and median). Show your work!
Step 5: Calculate the measures of spread for your data set (Range, IQR and MAD). Show your
work!
Step 6: Create a BOX PLOT comparison for the two sets of data. Be sure to label each box plot
(Mrs. Hampton's Class, My Data)
Step 7: Summary-Compare the two data sets. Discuss similarities and differences in the two sets
of data (think about striking deviations, gaps, peaks, clusters, etc.). In your summary, answer the
following questions.
-What conclusion can you draw from looking at each data set?
-What does the measures of center and measures of spread tell you about each data set?
-Is either data set skewed? How do you know?
-Is it possible to use either or both of these data sets to draw VALID conclusions about the
number of movies a person sees in one month? Why or why not?
-Can you draw the same conclusion from the two different sets of data? Why or why not?
-Which set of data is more "spread" out based on your visual and your calculations.
-Which is a better measure of spread, the Range or the IQR and Why?

Answers: 3


Another question on Mathematics
Mathematics, 20.06.2019 18:04
The price of a coat increased from $78 to $92. what is the price increase percentage?
Answers: 1
Mathematics, 21.06.2019 15:30
It takes a total of 6 hours to fill up an inground backyard pool using a standard house. a function can represent this situation to represent the amount of water in the pool until it is full a function of time the hose is running. determine the domain for the function
Answers: 1
Mathematics, 21.06.2019 16:00
What kind of bond pays interest which is exempt from tax?
Answers: 1
Mathematics, 21.06.2019 18:00
What set does not contain -3 the set of all real numbers the set of all integers the set of all whole numbers the set of all rational numbers
Answers: 1
You know the right answer?
A survey was conducted to determine how many movies were seen in one month among the students
in Mr...
Questions


Spanish, 25.09.2019 17:30

History, 25.09.2019 17:30

Biology, 25.09.2019 17:30
Biology, 25.09.2019 17:30
Mathematics, 25.09.2019 17:30
History, 25.09.2019 17:30


Social Studies, 25.09.2019 17:30
Mathematics, 25.09.2019 17:30
Mathematics, 25.09.2019 17:30
Biology, 25.09.2019 17:30

Advanced Placement (AP), 25.09.2019 17:30


