
Mathematics, 15.07.2021 16:50 josh200508
GUYS I NEED HELP I KEEP GETTING THIS ANSWER WRONG
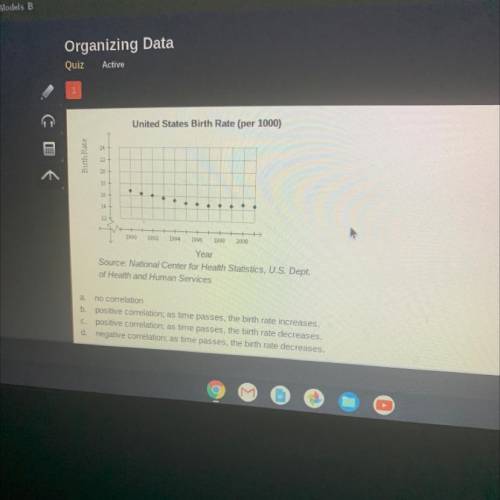
Determine whether the graph shows a positive correlation, a negative correlation, or no correlation. If there is a positive or
negative correlation, describe its meaning in the situation.
United States Birth Rate (per 1000)
Birth Rate
20
18
16
14
12-
1990
1992
1994
1996
1998
2000
Year
Source: National Center for Health Statistics, U. S. Dept.
of Health and Human Services
Darrelation

Answers: 2


Another question on Mathematics
Mathematics, 21.06.2019 16:00
Sam makes his sales calls according to a pattern. he travels either north or south depending on the calendar. some of his past trips were as follows: on february 17, april 24, june 10, september 19, and november 3 he drove north. on february 28, may 25, august 22, november 20, and december 18, he drove south. describe sams' pattern. in which direction will sam drive on oct4 and oct 24?
Answers: 1
Mathematics, 21.06.2019 18:20
The number if marbles of different colors stored in a hat is listed below: 4 red marbles 10 green marbles 7 blue marbles. without looking in the hat, dan takes out a marble at random. he replaces the marble and then takes out another marble from the hat. what is the probability that dan takes out a blue marble in both draws?
Answers: 1
Mathematics, 21.06.2019 23:30
(c) compare the results of parts (a) and (b). in general, how do you think the mode, median, and mean are affected when each data value in a set is multiplied by the same constant? multiplying each data value by the same constant c results in the mode, median, and mean increasing by a factor of c. multiplying each data value by the same constant c results in the mode, median, and mean remaining the same. multiplying each data value by the same constant c results in the mode, median, and mean decreasing by a factor of c. there is no distinct pattern when each data value is multiplied by the same constant. (d) suppose you have information about average heights of a random sample of airline passengers. the mode is 65 inches, the median is 72 inches, and the mean is 65 inches. to convert the data into centimeters, multiply each data value by 2.54. what are the values of the mode, median, and mean in centimeters? (enter your answers to two decimal places.) mode cm median cm mean cm in this problem, we explore the effect on the mean, median, and mode of multiplying each data value by the same number. consider the following data set 7, 7, 8, 11, 15. (a) compute the mode, median, and mean. (enter your answers to one (1) decimal places.) mean value = median = mode = (b) multiply 3 to each of the data values. compute the mode, median, and mean. (enter your answers to one (1) decimal places.) mean value = median = mode = --
Answers: 1
You know the right answer?
GUYS I NEED HELP I KEEP GETTING THIS ANSWER WRONG
Determine whether the graph shows a positive corr...
Questions


Computers and Technology, 18.02.2021 20:00
English, 18.02.2021 20:00

Mathematics, 18.02.2021 20:00
Mathematics, 18.02.2021 20:00
Mathematics, 18.02.2021 20:00

Mathematics, 18.02.2021 20:00

Mathematics, 18.02.2021 20:00
Mathematics, 18.02.2021 20:00
Mathematics, 18.02.2021 20:00

Social Studies, 18.02.2021 20:00


