
Mathematics, 16.07.2021 03:20 joanasprinkman2262
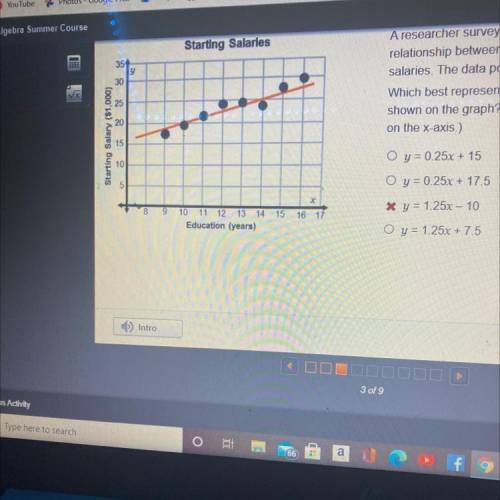
A researcher surveyed 8 people to see if there is a
relationship between years of education and starting
salaries. The data points are shown on the graph.
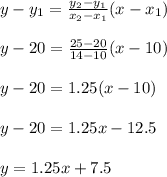
Which best represents the equation of the trend line
shown on the graph? (Note that the graph has a break
on the x-axis.)
O y = 0.25x + 15
O y = 0.25x + 17.5
* y = 1.25x - 10
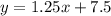
O y = 1.25x + 7.5

Answers: 3


Another question on Mathematics
Mathematics, 21.06.2019 16:00
Hello people, i have a math question that i need with, me, i will give the correct one brainiest, and for the other correct people, a and 5 stars.
Answers: 3
Mathematics, 21.06.2019 17:30
Add the fractions, and simply the result to lowest terms. 2/3 + 2/7= ?
Answers: 2
Mathematics, 21.06.2019 19:30
The amount spent on food and drink by 20 customers is shown below what is the modal amount spent and the median amount spent? 40 25 8 36 18 15 24 27 43 9 12 19 22 34 31 20 26 19 17 28
Answers: 1
Mathematics, 21.06.2019 20:20
Select the correct answer. what is the exact value of sin (157.5°)? a. 'sqrt(2 - sqrt(2))/2 b. *"-"'sqrt(2 + sqrt(2))/29 c.'sqrt(2 + sqrt(2))/4" d. "-"sqrt(2 + sqrt(2))/4)
Answers: 3
You know the right answer?
A researcher surveyed 8 people to see if there is a
relationship between years of education and sta...
Questions


Physics, 15.04.2020 03:16


History, 15.04.2020 03:16

Social Studies, 15.04.2020 03:16
History, 15.04.2020 03:16

English, 15.04.2020 03:16

Computers and Technology, 15.04.2020 03:16


