
Mathematics, 17.07.2021 01:00 Travon1418
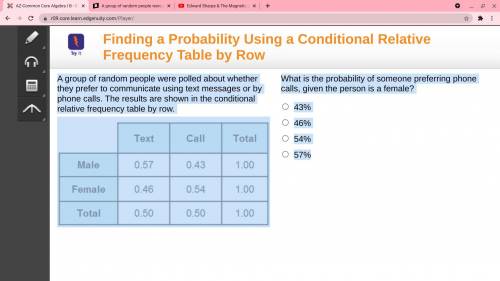
A group of random people were polled about whether they prefer to communicate using text messages or by phone calls. The results are shown in the conditional relative frequency table by row.
A 4-column table with 3 rows. The first column has no label with entries male, female, total. The second column is labeled text with entries 0.57, 0.46, 0.50. The third column is labeled call with entries 0.43, 0.54, 0.50. The fourth column is labeled total with entries 1.00, 1.00, 1.00.
What is the probability of someone preferring phone calls, given the person is a female?
43%
46%
54%
57%

Answers: 3


Another question on Mathematics
Mathematics, 21.06.2019 23:10
Which best describes the function on the graph? direct variation; k = −2 direct variation; k = -1/2 inverse variation; k = −2 inverse variation; k = -1/2
Answers: 2
Mathematics, 22.06.2019 02:00
What number gives you a irrational number when added to 2/5
Answers: 1
Mathematics, 22.06.2019 05:00
What number can each term of the equation be multiplied by to eliminate fractions before solving ? 6-3/4x+1/3=1/2x+5
Answers: 2
Mathematics, 22.06.2019 06:30
Lines b and c are parallel. what is the measure of angle 6? m6 = 45° m6 = 54° m6 = 117° m6 = 126°
Answers: 3
You know the right answer?
A group of random people were polled about whether they prefer to communicate using text messages or...
Questions

Business, 25.09.2021 22:20

English, 25.09.2021 22:20


Computers and Technology, 25.09.2021 22:20
Mathematics, 25.09.2021 22:20
Mathematics, 25.09.2021 22:20

Biology, 25.09.2021 22:20
Mathematics, 25.09.2021 22:20
English, 25.09.2021 22:20
Chemistry, 25.09.2021 22:20

History, 25.09.2021 22:20
English, 25.09.2021 22:20
Mathematics, 25.09.2021 22:20


