
Mathematics, 20.07.2021 19:30 preservations
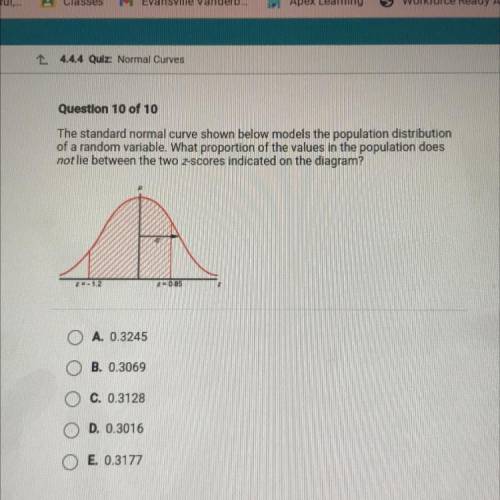
The standard normal curve shown below models the population distribution
of a random variable. What proportion of the values in the population does
not lie between the two z-scores indicated on the diagram?
A
2.1.2
2085
A. 0.3245
B. 0.3069
C. 0.3128
D. 0.3016
E. 0.3177

Answers: 1


Another question on Mathematics
Mathematics, 21.06.2019 23:20
Which best describes a central bank's primary goals? limiting inflation and reducing unemployment reducing unemployment and maintaining cash flow controlling stagflation and reducing unemployment managing credit and ensuring the money supply's liquidity
Answers: 1
Mathematics, 21.06.2019 23:40
Typically a point in a three dimensional cartesian coordinate system is represented by which of the following answers in the picture !
Answers: 1
You know the right answer?
The standard normal curve shown below models the population distribution
of a random variable. What...
Questions

Mathematics, 07.04.2020 20:33

Spanish, 07.04.2020 20:33
Mathematics, 07.04.2020 20:33

Social Studies, 07.04.2020 20:33

Computers and Technology, 07.04.2020 20:33


