
Mathematics, 20.07.2021 20:40 sarahsompayrac
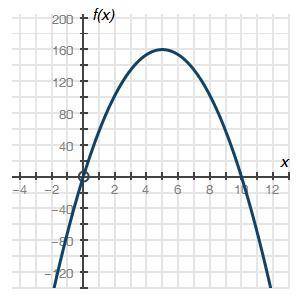
The graph below shows a company's profit f(x), in dollars, depending on the price of pencils x, in dollars, sold by the company.
Part A: What do the x-intercepts and maximum value of the graph represent? What are the intervals where the function is increasing and decreasing, and what do they represent about the sale and profit? (4 points)
Part B: What is an approximate average rate of change of the graph from x = 2 to x = 5, and what does this rate represent? (3 points)
Part C: Describe the constraints of the domain. (3 points)

Answers: 2


Another question on Mathematics
Mathematics, 21.06.2019 18:00
Solve this system of equations. 12x − 18y = 27 4x − 6y = 10
Answers: 1
Mathematics, 21.06.2019 18:50
Which translation maps the vertex of the graph of the function f(x) = x2 onto the vertex of the function g(x) = x2 – 10x +2?
Answers: 1
Mathematics, 21.06.2019 22:00
Billie holiday sells children's clothing for sara vaughn's toddler shop. baby blankets sell for $29.99 after a markup rate based on cost of 109%. find the cost and the markup.
Answers: 2
Mathematics, 21.06.2019 22:30
What is the least common multiple for 6 and 8? what is the least common multiple for 4 and 12 ? what is the least common multiple for 11 and 12? what is the least common multiple for 3 and 6?
Answers: 1
You know the right answer?
The graph below shows a company's profit f(x), in dollars, depending on the price of pencils x, in d...
Questions

Mathematics, 02.10.2020 19:01
Mathematics, 02.10.2020 19:01
History, 02.10.2020 19:01

Mathematics, 02.10.2020 19:01
Mathematics, 02.10.2020 19:01

Mathematics, 02.10.2020 19:01
Mathematics, 02.10.2020 19:01
Mathematics, 02.10.2020 19:01
History, 02.10.2020 19:01


