
Mathematics, 21.07.2021 05:20 BurwinkelElla19
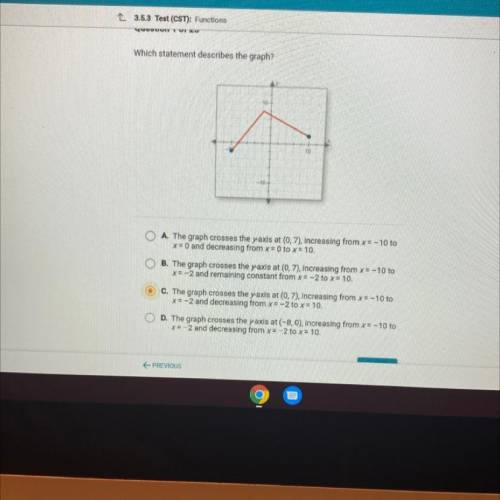
Which statement describes the graph?
O A. The graph crosses the y-axis at (0,7), increasing from x = -10 to
x = 0 and decreasing from x = 0 to x = 10.
O B. The graph crosses the y-axis at (0,7), increasing from x = -10 to
x= -2 and remaining constant from x = -2 to x = 10.
O C. The graph crosses the y-axis at (0,7), increasing from x= -10 to
x = -2 and decreasing from x = -2 to x= 10.
O D. The graph crosses the yaxis at (-8,0), increasing from x = -10 to
x=-2 and decreasing from x = -2 to x = 10.
PREVIOUS

Answers: 1


Another question on Mathematics
Mathematics, 21.06.2019 13:20
Given f(x) = 10x + 4 and g(x) = 3x - 8, what is f(x) + g(x) ? - 7x - 4 - 13x + 4 - 7x + 4 - 13x - 4
Answers: 2
Mathematics, 21.06.2019 19:30
The table below represents the displacement of a fish from its reef as a function of time: time (hours) x displacement from reef (feet) y 0 4 1 64 2 124 3 184 4 244 part a: what is the y-intercept of the function, and what does this tell you about the fish? (4 points) part b: calculate the average rate of change of the function represented by the table between x = 1 to x = 3 hours, and tell what the average rate represents. (4 points) part c: what would be the domain of the function if the fish continued to swim at this rate until it traveled 724 feet from the reef? (2 points)
Answers: 2
Mathematics, 21.06.2019 23:40
Select the correct answer what is the 10th term of the geometric sequence 3,6, 12, 24,48 a. 512 b. 3,072 c. 768 d. 1,536
Answers: 2
You know the right answer?
Which statement describes the graph?
O A. The graph crosses the y-axis at (0,7), increasing from x...
Questions
Mathematics, 20.09.2020 05:01

History, 20.09.2020 05:01
History, 20.09.2020 05:01

Mathematics, 20.09.2020 05:01
English, 20.09.2020 05:01
English, 20.09.2020 05:01
History, 20.09.2020 05:01
Mathematics, 20.09.2020 05:01

Chemistry, 20.09.2020 05:01
Mathematics, 20.09.2020 05:01
History, 20.09.2020 05:01


Geography, 20.09.2020 05:01


