Look at the graph shown:
(image below)
Which equation best represents the line...

Mathematics, 21.07.2021 22:30 Nobleufia
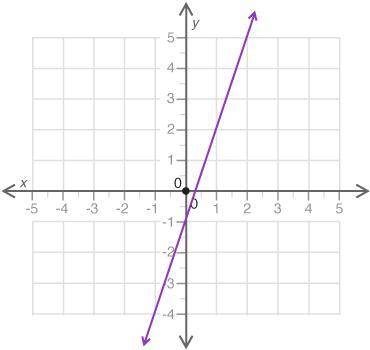
Look at the graph shown:
(image below)
Which equation best represents the line?
y = 1 over 3. x − 1
y = 3x − 1
y = −x + 1 over 3.
y = 3x + 1
NO LINKS PLEASE :)

Answers: 3


Another question on Mathematics
Mathematics, 21.06.2019 13:30
Drag and drop the answers into the boxes to complete this informal argument explaining how to derive the formula for the volume of a cone. since the volume of a cone is part of the volume of a cylinder with the same base and height, find the volume of a cylinder first. the base of a cylinder is a circle. the area of the base of a cylinder is , where r represents the radius. the volume of a cylinder can be described as slices of the base stacked upon each other. so, the volume of the cylinder can be found by multiplying the area of the circle by the height h of the cylinder. the volume of a cone is of the volume of a cylinder. therefore, the formula for the volume of a cone is 1/3 1/2 1/3πr^2h 1/2πr^2h πr^2h πr^2
Answers: 3
Mathematics, 21.06.2019 19:00
Since opening night, attendance at play a has increased steadily, while attendance at play b first rose and then fell. equations modeling the daily attendance y at each play are shown below, where x is the number of days since opening night. on what day(s) was the attendance the same at both plays? what was the attendance? play a: y = 8x + 191 play b: y = -x^2 + 26x + 126 a. the attendance was never the same at both plays. b. the attendance was the same on day 5. the attendance was 231 at both plays on that day. c. the attendance was the same on day 13. the attendance was 295 at both plays on that day. d. the attendance was the same on days 5 and 13. the attendance at both plays on those days was 231 and 295 respectively.
Answers: 1
Mathematics, 22.06.2019 00:00
Apolygon is shown on the graph: a polygon is shown on the coordinate plane. vertices are located at 3 comma 5, 1 comma 3, 1 comma 1, 2 comma 0, 4 comma 0, 5 comma 1, and 5 comma 3. what effect will a translation 3 units down and 2 units left have on the polygon? be sure to address how it could impact the angles, side lengths, and congruency between the original pre-image and the image. xd i need
Answers: 3
You know the right answer?
Questions


History, 25.08.2019 22:20

History, 25.08.2019 22:20
Mathematics, 25.08.2019 22:20
Mathematics, 25.08.2019 22:20
Mathematics, 25.08.2019 22:20
Social Studies, 25.08.2019 22:20

History, 25.08.2019 22:20


