
Mathematics, 22.07.2021 18:00 janeou17xn
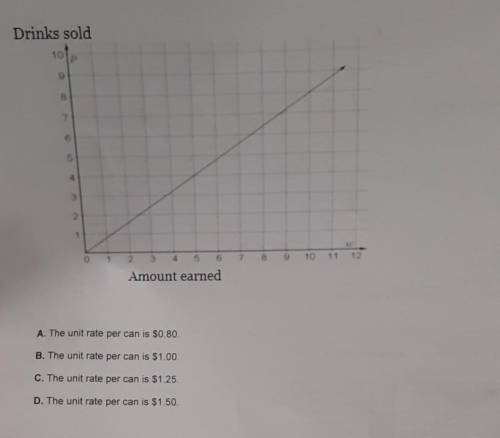
11. Jonathan Cole drew the graph below to show the amount he earned in can drink sales. Which unit rate best describes Jonathan Cole's graph?

Answers: 3


Another question on Mathematics
Mathematics, 21.06.2019 21:00
Abakery recorded the number of muffins and bagels it sold for a seven day period. for the data presented, what does the value of 51 summarize? a) mean of bagels b) mean of muffins c) range of bagels d) range of muffins sample # 1 2 3 4 5 6 7 muffins 61 20 32 58 62 61 56 bagels 34 45 43 42 46 72 75
Answers: 2
Mathematics, 21.06.2019 21:10
Mackenzie needs to determine whether the rectangles are proportional. which process could she use? check all that apply.
Answers: 1
Mathematics, 21.06.2019 22:20
The school track has eight lanes. each lane is 1.25 meters wide. the arc at each end of the track is 180. the distance of the home straight and the radii for the arcs in the 1st 4 lanes are given. s=85m r1=36.5m r2=37.75m r3=39m r4=40.25m part one: find the radii of lanes 5 through 8 of the track. show your work. part two: if max ran around lane one, how far did he run? show your work and explain your solution. part three: max wants to run a total of three laps around the track, choose two additional lanes (2-8) for him to run and find the distance around those two lanes. show your work and round to the hundredths. part 4: based on your lane choices in part three, what was the total distance max ran in the three laps around the track?
Answers: 2
Mathematics, 22.06.2019 01:00
The weight of 46 new patients of a clinic from the year 2018 are recorded and listed below. construct a frequency distribution, using 7 classes. then, draw a histogram, a frequency polygon, and an ogive for the data, using the relative information from the frequency table for each of the graphs. describe the shape of the histogram. data set: 130 192 145 97 100 122 210 132 107 95 210 128 193 208 118 196 130 178 187 240 90 126 98 194 115 212 110 225 187 133 220 218 110 104 201 120 183 124 261 270 108 160 203 210 191 180 1) complete the frequency distribution table below (add as many rows as needed): - class limits - class boundaries - midpoint - frequency - cumulative frequency 2) histogram 3) frequency polygon 4) ogive
Answers: 1
You know the right answer?
11. Jonathan Cole drew the graph below to show the amount he earned in can drink sales. Which unit r...
Questions

Chemistry, 01.08.2019 20:00


Computers and Technology, 01.08.2019 20:00

Mathematics, 01.08.2019 20:00


Physics, 01.08.2019 20:00
History, 01.08.2019 20:00


