
Mathematics, 22.07.2021 22:20 unruhlsY25
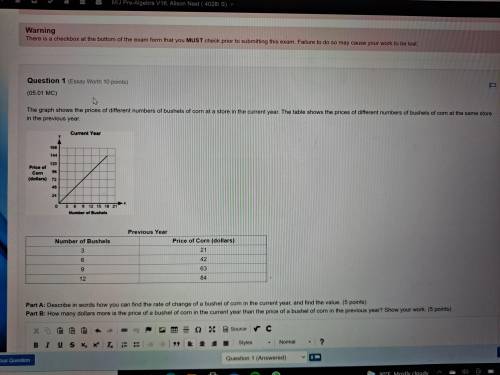
The graph shows the prices of different numbers of bushels of corn at a store in the current year. The table shows the prices of different numbers of bushels of corn at the same store in the previous year.
A graph shows Number of Bushels on x-axis and Price of Corn in dollars on y-axis. The x-axis scale is shown from 0 to 21 at increments of 3, and the y-axis scale is shown from 0 to 168 at increments of 24. A straight line joins the ordered pairs 3, 24 and 6, 48 and 9, 72 and 12, 96 and 15, 120 and 18, 144.
Previous Year
Number of Bushels
Price of Corn (dollars)
3
21
6
42
9
63
12
84
Part A: Describe in words how you can find the rate of change of a bushel of corn in the current year, and find the value. (5 points)
Part B: How many dollars more is the price of a bushel of corn in the current year than the price of a bushel of corn in the previous year? Show your work. (5 points)

Answers: 2


Another question on Mathematics
Mathematics, 21.06.2019 17:30
Jacks bank statement shows an account balance of -$25.50. which describes the magnitude, of size, of the debt in dollars
Answers: 2
Mathematics, 21.06.2019 17:30
One line passes through (-7,-4) and (5,4) . another line passes through the point (-4,6) and (6,-9)
Answers: 1
Mathematics, 21.06.2019 22:00
Alex took his brother to a birthday party. the party was scheduled to last for 1 and 3/4 hours but they stayed for 4/5 of an hour more. how long did she stay at the party?
Answers: 2
You know the right answer?
The graph shows the prices of different numbers of bushels of corn at a store in the current year. T...
Questions
Mathematics, 29.01.2021 22:30

Mathematics, 29.01.2021 22:30
Mathematics, 29.01.2021 22:30
Mathematics, 29.01.2021 22:30


Arts, 29.01.2021 22:30
Mathematics, 29.01.2021 22:30
Mathematics, 29.01.2021 22:30

History, 29.01.2021 22:30
Social Studies, 29.01.2021 22:30


Chemistry, 29.01.2021 22:30


