Part A
Using the stock information found during your research, complete the table.
Part...

Mathematics, 24.07.2021 20:10 lindasuebairdoyjpf7
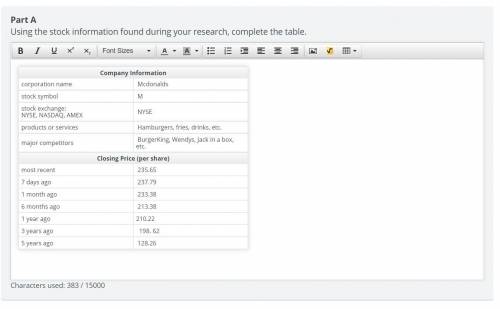
Part A
Using the stock information found during your research, complete the table.
Part B
Use the information you’ve gathered about the stock to answer these questions.
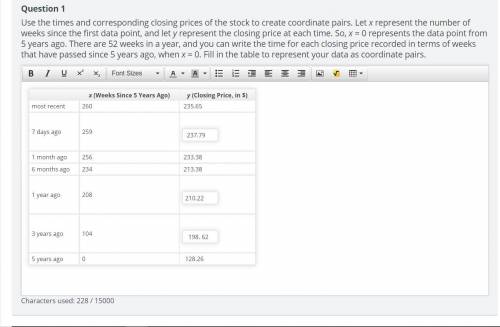
Question 1
Use the times and corresponding closing prices of the stock to create coordinate pairs. Let x represent the number of weeks since the first data point, and let y represent the closing price at each time. So, x = 0 represents the data point from 5 years ago. There are 52 weeks in a year, and you can write the time for each closing price recorded in terms of weeks that have passed since 5 years ago, when x = 0. Fill in the table to represent your data as coordinate pairs.
Question 2
Open the graphing tool, and select the data tab. Copy and paste your data from the table (x- and y-coordinates). Don’t include any dollar signs. Plot the data on the graph.
Under the relationship tab, use the linear, exponential, and quadratic function tools with “best fit” selected to view the regression model. Zooming in and out will help you get a better view of each fit. Observe how well each model fits the data. Rank the three function types (linear, exponential, quadratic) in order from best fit to worst fit.
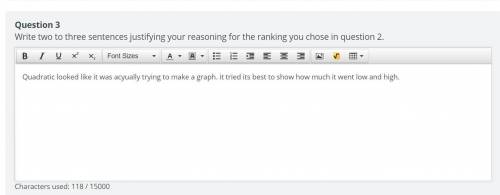
Question 3
Write two to three sentences justifying your reasoning for the ranking you chose in question 2.
Part C
Stock values for a certain company are recorded in the table.
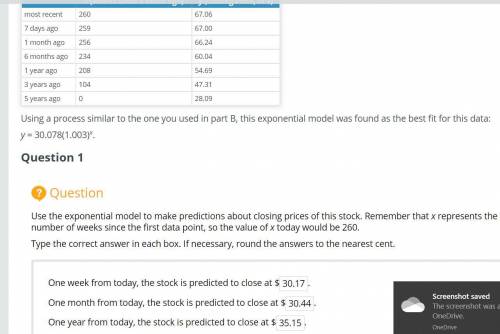
Using a process similar to the one you used in part B, this exponential model was found as the best fit for this data:
y = 30.078(1.003)x.
Use the exponential model to make predictions about closing prices of this stock. Remember that x represents the number of weeks since the first data point, so the value of x today would be 260.
Type the correct answer in each box. If necessary, round the answers to the nearest cent.
Do you think the model is a good predictor of the future closing price of the stock? Justify your response in three to four sentences.


Answers: 1


Another question on Mathematics
Mathematics, 21.06.2019 15:10
Apatient is given 50 mg dose of medicine the medicines effectiveness decreases every hour at a constant rate of 40% what is the exponential decay function that models this scenario how much medicine will be left in the patients system after 2 hours
Answers: 3
Mathematics, 21.06.2019 15:30
Find the slope of the line below . enter your answer as a fraction or decimal. use a slash mark ( / ) as the fraction bar if necessary
Answers: 3
Mathematics, 21.06.2019 17:00
There are 15 plates and each plate is either 7 or 12 inches diameter. which systems of equations do you use to find the number of 7 inch plates, x and 12 inch plates, y
Answers: 1
Mathematics, 21.06.2019 18:30
Abus travels 36 miles in 45 minutes. enter the number of miles the bus travels in 60 minutes at this rate.
Answers: 2
You know the right answer?
Questions
Mathematics, 07.05.2021 15:40
Mathematics, 07.05.2021 15:40

Mathematics, 07.05.2021 15:40

Mathematics, 07.05.2021 15:40
Mathematics, 07.05.2021 15:40

Mathematics, 07.05.2021 15:40
Mathematics, 07.05.2021 15:40
Mathematics, 07.05.2021 15:40
Social Studies, 07.05.2021 15:40


