Which models best illustrates the inequality and its graph?
t< 55
a.) t is at least...

Mathematics, 25.07.2021 07:30 sickomode2048
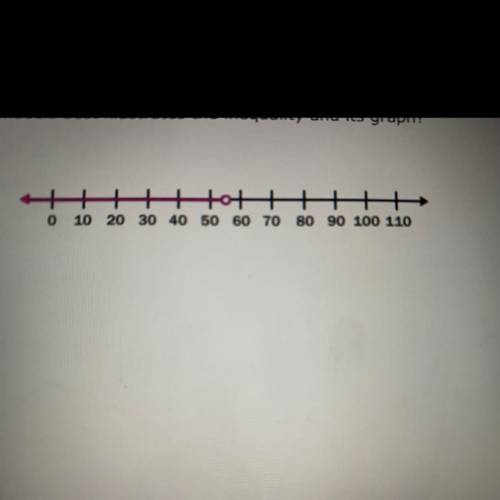
Which models best illustrates the inequality and its graph?
t< 55
a.) t is at least 55
b.) t is less than 55
c.) t is 55 or more
d.) t is at most 55

Answers: 1


Another question on Mathematics
Mathematics, 21.06.2019 13:00
Atriangle includes one angle that 72º. which pair could be the measures of the other two angles of the triangle? a. 9º, 9º b. 26º, 46º c. 53º, 55º d. 72º, 108º
Answers: 2
Mathematics, 21.06.2019 14:30
Click on the graphic until you find the right quotient. (36xa - 30xb) ÷ (-6x2)
Answers: 3
Mathematics, 21.06.2019 17:30
Which of the following tables represents exponential functions?
Answers: 1
Mathematics, 21.06.2019 18:50
Find the center and the radius of the circle with the equation: x^2-2x+y^2+4y+1=0?
Answers: 1
You know the right answer?
Questions


English, 19.07.2019 23:30


History, 19.07.2019 23:30
History, 19.07.2019 23:30
English, 19.07.2019 23:30
Chemistry, 19.07.2019 23:30

Social Studies, 19.07.2019 23:30
Mathematics, 19.07.2019 23:30
History, 19.07.2019 23:30


