
Mathematics, 25.07.2021 09:10 rizha55
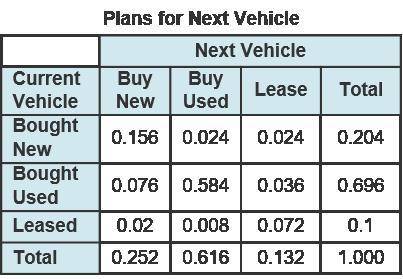
The table shows the marginal relative frequencies of surveyed drivers’ plans for their next vehicle.
A 2-way table. A 5-column with 4 rows titled Plan for Next Vehicle. Column 1 has entries Current vehicle, bought new, bought used, leased total. Column 2 is labeled Buy new with entries 0.156, 0.076, 0.02, 0.252. Column 3 is labeled Buy used with entries 0.024, 0.584, 0.008, 0.616. Column 4 is labeled Lease with entries 0.024, 0.036, 0.072, 0.132. Column 5 is labeled Total with entries 0.204, 0.696, 0.1, 1.000.
Which statements appropriately interpret data from the table? Check all that apply.
The majority of drivers, about 62 percent, plan to buy a used vehicle next.
About 25 drivers plan to buy a new vehicle next.
Ten percent of drivers lease their current vehicle.
Only 1.3 percent of drivers plan to lease next.
The least percentage of people will lease their next car.

Answers: 3


Another question on Mathematics
Mathematics, 21.06.2019 21:00
Factor the trinomial below. 12x^2 - 32x - 12 a. 4(3x+3)(x-1) b. 4(3x+1)(x-3) c. 4(3x+6)(x-2) d. 4(3x+2)(x-6)
Answers: 2
Mathematics, 21.06.2019 23:00
Siri can type 90 words in 40 minutes about how many words would you expect her to type in 10 minutes at this rate
Answers: 1
Mathematics, 22.06.2019 04:10
Random variables x poisson~ ( a) ,y poisson ~ ( a) . x and y are independent. if 2 1, 2 1. u =2x+ y-1, v=2x- y +1. find: ) cov (u ,v ).
Answers: 2
You know the right answer?
The table shows the marginal relative frequencies of surveyed drivers’ plans for their next vehicle....
Questions


History, 07.10.2019 21:30
Biology, 07.10.2019 21:30
History, 07.10.2019 21:30

Mathematics, 07.10.2019 21:30
Mathematics, 07.10.2019 21:30

Health, 07.10.2019 21:30
Mathematics, 07.10.2019 21:30

History, 07.10.2019 21:30


