
Mathematics, 26.07.2021 23:30 manasangreddy2921
PLZ HELP
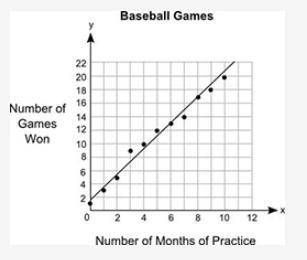
The graph below shows the relationship between the number of months different students practiced baseball and the number of games they won:
Part A: What is the approximate y-intercept of the line of best fit and what does it represent? (5 points)
Part B: Write the equation for the line of best fit in slope-intercept form and use it to predict the number of games that could be won after 13 months of practice. Show your work and include the points used to calculate the slope. (5 points)

Answers: 2


Another question on Mathematics
Mathematics, 21.06.2019 16:00
Awall map has a scale of 128 miles = 6 inches. the distance between springfield and lakeview is 2 feet on the map. what is the actual distance between springfield and lakeview? 384 miles 512 miles 1.13 miles 42.7 miles
Answers: 1
Mathematics, 21.06.2019 19:00
Draw a scaled copy of the circle using a scale factor of 2
Answers: 1
Mathematics, 21.06.2019 20:30
Drag the tiles to the correct boxes to complete the pairs. not all tiles will be used. match each division expression with the correct quotient.
Answers: 2
Mathematics, 21.06.2019 20:50
What is the greatest number of parts of a circle that can be formed by cutting the circle with 7 straight cuts? (note: the parts do not have to be equal in size)
Answers: 3
You know the right answer?
PLZ HELP
The graph below shows the relationship between the number of months different students pra...
Questions

SAT, 17.02.2021 22:50

Computers and Technology, 17.02.2021 22:50


History, 17.02.2021 22:50
Mathematics, 17.02.2021 22:50

History, 17.02.2021 22:50
Mathematics, 17.02.2021 22:50
Mathematics, 17.02.2021 22:50
English, 17.02.2021 22:50

Chemistry, 17.02.2021 22:50


