
Mathematics, 27.07.2021 06:10 gray69
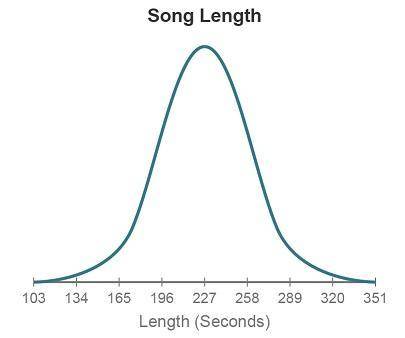
The graph shows the distribution of lengths of songs (in seconds). The distribution is approximately Normal, with a mean of 227 seconds and a standard deviation of 31 seconds.
A graph titled Song length has length (seconds) on the x-axis, going from 103 to 351 in increments of 31. The highest point of the curve is at 227.
What percentage of songs have lengths that are within 31 seconds of the mean?
34%
68%
95%
99.7%

Answers: 2


Another question on Mathematics
Mathematics, 21.06.2019 14:30
Ahomeowner plans to hang wallpaper on one wall of a bedroom that is 10 feet long if a stripe of wallpaper is 20 inches wide and stripes or hung vertically how many stripes on wall paper with the homeowner required
Answers: 1
Mathematics, 21.06.2019 18:30
The volume of gas a balloon can hold varies directly as the cube of its radius. imagine a balloon with a radius of 3 inches can hold 81 cubic inches of gas. how many cubic inches of gas must be released to reduce the radius down to 2 inches?
Answers: 1
Mathematics, 21.06.2019 19:00
Atheater wants to build movable steps that they can use to go on and off the stage. they want the steps to have enough space inside so they can also be used to store props. how much space is inside the steps?
Answers: 1
You know the right answer?
The graph shows the distribution of lengths of songs (in seconds). The distribution is approximately...
Questions


Mathematics, 22.09.2020 04:01
Engineering, 22.09.2020 04:01

Computers and Technology, 22.09.2020 04:01

Mathematics, 22.09.2020 04:01


English, 22.09.2020 04:01


