
Mathematics, 27.07.2021 17:50 sanchitcoolcham7362
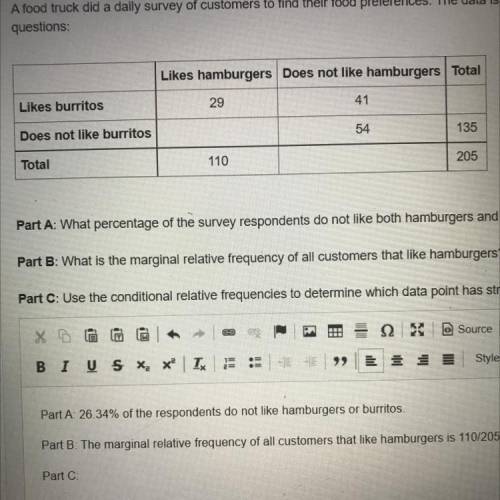
A food truck did a daily survey of customers to find their food preferences. The data is partially entered in the frequency table. Complete the table to analyze the data and answer the Questions.
Likes hamburgers
Does not like hamburgers Total
Likes burritos
29
41
Does not like burritos
54
135
Total
110
205
Part A:What percentage of the survey respondents do not like both hamburgers and burritos?
Part B:
What is the marginal relative frequency of all customers that like hamburgers?
Part C.
Use the conditional relative frequencies to determine which data point has strongest association of its two factors. Use complete sentences to explain your answer.

Answers: 2


Another question on Mathematics
Mathematics, 21.06.2019 15:30
What is this inequality notation? t is less then or equal to 2
Answers: 3
Mathematics, 22.06.2019 01:10
Given: ae ≅ ce ; de ≅ be prove: abcd is a parallelogram. we have that ab || dc. by a similar argument used to prove that △aeb ≅ △ced, we can show that △ ≅ △ceb by. so, ∠cad ≅ ∠ by cpctc. therefore, ad || bc by the converse of the theorem. since both pair of opposite sides are parallel, quadrilateral abcd is a parallelogram.
Answers: 3
You know the right answer?
A food truck did a daily survey of customers to find their food preferences. The data is partially e...
Questions
Mathematics, 20.07.2019 19:10

Health, 20.07.2019 19:10

History, 20.07.2019 19:10
History, 20.07.2019 19:10

Mathematics, 20.07.2019 19:10
Mathematics, 20.07.2019 19:10

Mathematics, 20.07.2019 19:10

Physics, 20.07.2019 19:10

Mathematics, 20.07.2019 19:10

Arts, 20.07.2019 19:10


