
Mathematics, 28.07.2021 07:00 lizdominguez101
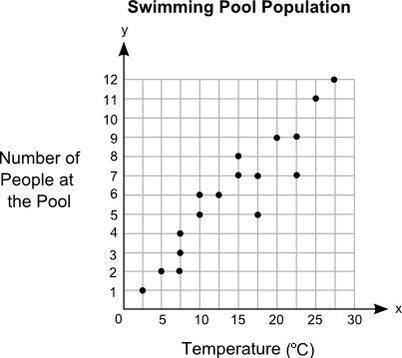
Meg plotted the graph below to show the relationship between the temperature of her city and the number of people at a swimming pool:
Part A: In your own words, describe the relationship between the temperature of the city and the number of people at the swimming pool. (5 points)
Part B: Describe how you can make the line of best fit. Write the approximate slope and y-intercept of the line of best fit. Show your work, including the points that you use to calculate slope and y-intercept. (5 points)

Answers: 1


Another question on Mathematics
Mathematics, 21.06.2019 14:50
An assembly consists of two mechanical components. suppose that the probabilities that the first and second components meet specifications are 0.87 and 0.84. assume that the components are independent. determine the probability mass function of the number of components in the assembly that meet specifications. x
Answers: 1
Mathematics, 21.06.2019 15:00
If x = ∛200, which of the following inequalities is true? * 2 < x < 4 3 < x < 5 6 < x < 6.5 4.5 < x < 5.5 5 < x < 6
Answers: 1
Mathematics, 21.06.2019 18:00
Acompany wants to reduce the dimensions of its logo by one fourth to use on business cards. if the area of the original logo is 4 square inches, what is the area of the logo that will be used on the business cards?
Answers: 1
Mathematics, 21.06.2019 22:40
Identify this conic section. x2 - y2 = 16 o line circle ellipse parabola hyperbola
Answers: 2
You know the right answer?
Meg plotted the graph below to show the relationship between the temperature of her city and the num...
Questions


Chemistry, 20.12.2019 15:31

English, 20.12.2019 15:31
Mathematics, 20.12.2019 15:31
History, 20.12.2019 15:31

Mathematics, 20.12.2019 15:31
English, 20.12.2019 15:31
English, 20.12.2019 15:31
History, 20.12.2019 15:31

Mathematics, 20.12.2019 15:31
Biology, 20.12.2019 15:31


