
Mathematics, 28.07.2021 23:10 dessera12
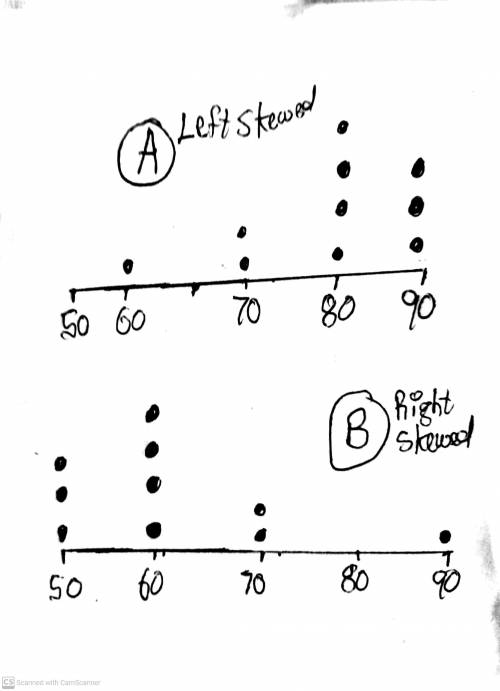
A data set is displayed using a dot plot. The range of the data is between 50 and 90, and the distribution is skewed left. Where is there most likely a peak in the data?
left side of the graph
right side of the graph
middle of the graph
cannot be determined without more information
please help

Answers: 1


Another question on Mathematics
Mathematics, 21.06.2019 18:40
Juliana says that she can use the patterns of equivalent ratios in the multiplication table below to write an infinite number of ratios that are equivalent to 6: 10. which statement explains whether juliana is correct? she is correct because she can multiply 6 and 10 by any number to form an equivalent ratio. she is correct because 6: 10 can be written as 1: 2 and there are an infinite number of ratios for 1: 2. she is not correct because the multiplication table does not include multiples of 10. she is not correct because 6: 10 is equivalent to 3: 5 and there are only 9 ratios in the multiplication table that are equivalent to 3: 5.
Answers: 1
Mathematics, 22.06.2019 04:00
The ratio of the ages (in years) of three children is 2: 4: 5. the sum of their ages is 33. what is the age of each child?
Answers: 1
Mathematics, 22.06.2019 05:10
Pl approximate the value of 13−−√ to the nearest tenths place. plot the approximation on the number line.
Answers: 3
You know the right answer?
A data set is displayed using a dot plot. The range of the data is between 50 and 90, and the distri...
Questions
Mathematics, 06.05.2020 01:39


History, 06.05.2020 01:40


Mathematics, 06.05.2020 01:40
Mathematics, 06.05.2020 01:40

Mathematics, 06.05.2020 01:40


