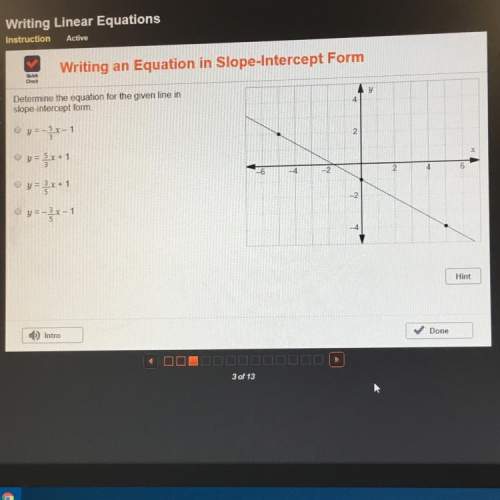
PLEASE HELP ASAP
Question:
Which of the following is true of the data set represented by...

Mathematics, 30.07.2021 04:00 nagwaelbadawi
PLEASE HELP ASAP
Question:
Which of the following is true of the data set represented by the box plot?
box plot with point at 16, min at 33, Q1 at 40, median at 52, Q3 at 55, max at 78, and point at 86
A: If the outliers were included in the data, the mean would increase significantly.
B: If the outliers were included in the data, the box plot would be significantly skewed.
C: If the outliers were included in the data, the median would not significantly change.
D: If the outliers were included in the data, the length of the tails would not change.

Answers: 3


Another question on Mathematics

Mathematics, 20.06.2019 18:04
Aquadratic function f(x) has a turning point at (3,-7). what is the turning point of -f(x)?
Answers: 1


Mathematics, 22.06.2019 01:20
Aprobability experiment is conducted in which the sample space of the experiment is s={7,8,9,10,11,12,13,14,15,16,17,18}, event f={7,8,9,10,11,12}, and event g={11,12,13,14}. assume that each outcome is equally likely. list the outcomes in f or g. find p(f or g) by counting the number of outcomes in f or g. determine p(f or g) using the general addition rule.
Answers: 2

Mathematics, 22.06.2019 03:00
Monthly water bills for a city have a mean of $108.43 and a standard deviation of $36.98. find the probability that a randomly selected bill will have an amount greater than $173, which the city believes might indicate that someone is wasting water. would a bill that size be considered unusual?
Answers: 3
You know the right answer?
Questions

World Languages, 09.10.2019 09:30


Mathematics, 09.10.2019 09:30


Mathematics, 09.10.2019 09:30

Mathematics, 09.10.2019 09:30


Geography, 09.10.2019 09:30


Computers and Technology, 09.10.2019 09:30


Mathematics, 09.10.2019 09:30

History, 09.10.2019 09:30

Mathematics, 09.10.2019 09:30


Business, 09.10.2019 09:30

Mathematics, 09.10.2019 09:30


