Mathematics, 03.08.2021 06:00 vonteee2
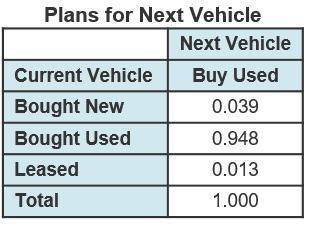
The table shows a set of conditional relative frequencies of drivers in a survey planning to buy a used vehicle next, based on how they obtained their current vehicle.
Which interpretation of the relative frequencies given is the most appropriate?
A. The greatest number of drivers who plan to buy used are those who leased their current vehicle.
B. The majority of drivers who will buy used next time bought their current vehicle used.
C. Of drivers who bought their current vehicle used, about 4 percent will buy new next time, almost 95 percent will buy used next time, and about 1 percent will lease next time.
D. Of drivers who bought new, 3.9 percent will buy used next time; of drivers who bought used, 94.8 percent will buy used again; of drivers who leased, 1.3 percent will buy used.


Answers: 1


Another question on Mathematics

Mathematics, 21.06.2019 14:50
Cumulative examcumulative exam active13time remaining02: 44: 18the graph represents the data cost for monthly internetservice for a cell phone.which function, c(x), represents the monthly cost in dollarsin terms of x, the number of gigabytes used in a month? cell phone internet service(15,5x + 10150,0sx522 < x < 664x115, osx< 25x + 20, 2< x< 650, 65815%,monthly cost (s)20x + 5| 50x,0 < x < 22 < x < 664x( 15x, osx< 2c(x) = 5x + 10, 2< x< 6150x, 65 x5+1234 5 6 7 8 9 10 11 12gigabytes used
Answers: 1

Mathematics, 21.06.2019 21:00
Roger could feed 5 walruses with 4 kilograms of fish. how many walruses could he feed with 7.2 kilograms of fish?
Answers: 1

Mathematics, 21.06.2019 23:30
Atown has a population of 17000 and grows at 2.5% every year. to the nearest year, how long will it be until the population will reach 19600?
Answers: 1

Mathematics, 22.06.2019 01:50
Lesson 9-3 for items 8-10, a square is drawn in the coordinate plane, with vertices as shown in the diagram. then the square is reflected across the x-axis. -2 4 8. the function that describes the reflection is (x, y) - a. (x, y-3). b. (x, y-6). c. (-x, y). d. (x,- y).
Answers: 2
You know the right answer?
The table shows a set of conditional relative frequencies of drivers in a survey planning to buy a u...
Questions

Mathematics, 24.02.2021 15:10

Medicine, 24.02.2021 15:10

Business, 24.02.2021 15:10

Mathematics, 24.02.2021 15:10

Mathematics, 24.02.2021 15:10


Social Studies, 24.02.2021 15:10

Mathematics, 24.02.2021 15:10

Business, 24.02.2021 15:10


Computers and Technology, 24.02.2021 15:10


Mathematics, 24.02.2021 15:10


