
Mathematics, 06.08.2021 21:40 madiiiiiii69
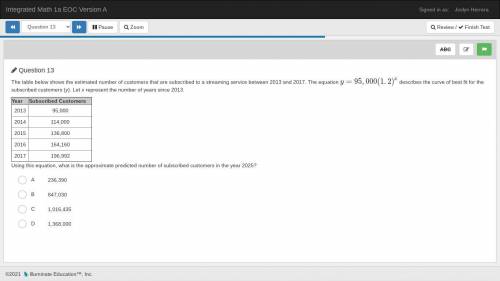
The table below shows the estimated number of customers that are subscribed to a streaming service between 2013 and 2017. The equation y=95,000(1.2)x describes the curve of best fit for the subscribed customers (y). Let x represent the number of years since 2013.
Year Subscribed Customers
2013 95,000
2014 114,000
2015 136,800
2016 164,160
2017 196,992
Using this equation, what is the approximate predicted number of subscribed customers in the year 2025?
A
236,390
B
847,030
C
1,016,435
D
1,368,000

Answers: 1


Another question on Mathematics
Mathematics, 21.06.2019 17:30
Asphere has a diameter of 10 in. what is the volume of the sphere?
Answers: 1
Mathematics, 21.06.2019 20:00
Which of the following is the inverse of y = 3∧x y = 1/3∧x y = ㏒3x y = (1/3) ∧x y = ㏒ 1/3∧x
Answers: 1
You know the right answer?
The table below shows the estimated number of customers that are subscribed to a streaming service b...
Questions

Computers and Technology, 29.11.2020 16:00

Physics, 29.11.2020 16:00
Mathematics, 29.11.2020 16:00

Advanced Placement (AP), 29.11.2020 16:00
Mathematics, 29.11.2020 16:00
Physics, 29.11.2020 16:00
Mathematics, 29.11.2020 16:00

Mathematics, 29.11.2020 16:00
Mathematics, 29.11.2020 16:00
English, 29.11.2020 16:00
Mathematics, 29.11.2020 16:00

Chemistry, 29.11.2020 16:00
English, 29.11.2020 16:00
Mathematics, 29.11.2020 16:00

Mathematics, 29.11.2020 16:00
Mathematics, 29.11.2020 16:00
Physics, 29.11.2020 16:00


